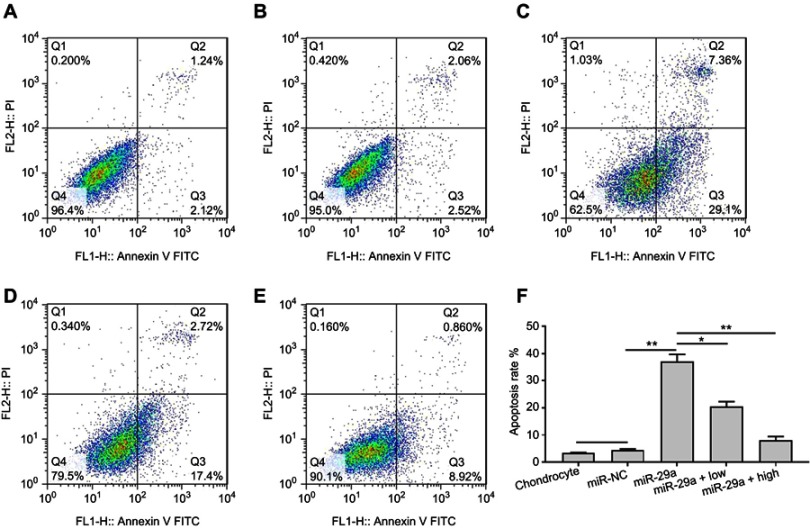
Figure 3.
Inhibitory effects of TMF on apoptosis in miR-29a mimics-transfected chondrocytes. Group (A) was normal untreated chondrocytes. Group (B) was miRNA mimic negative control. Group (C) was miR-29a mimics-transfected chondrocytes. Group (D) was miR-29a mimics-transfected chondrocytes +5 μg/mL TMF (low) treatment. Group (E) was miR-29a mimics-transfected chondrocytes +20 μg/mL TMF (high) treatment. Figure (F) was the summarized data indicating the rate of chondrocytes apoptosis detected by flow cytometry. Data were presented by mean ± SD of 3 replicates. P<0.05 was considered to be statistically significant (*P<0.05, **P<0.01).

