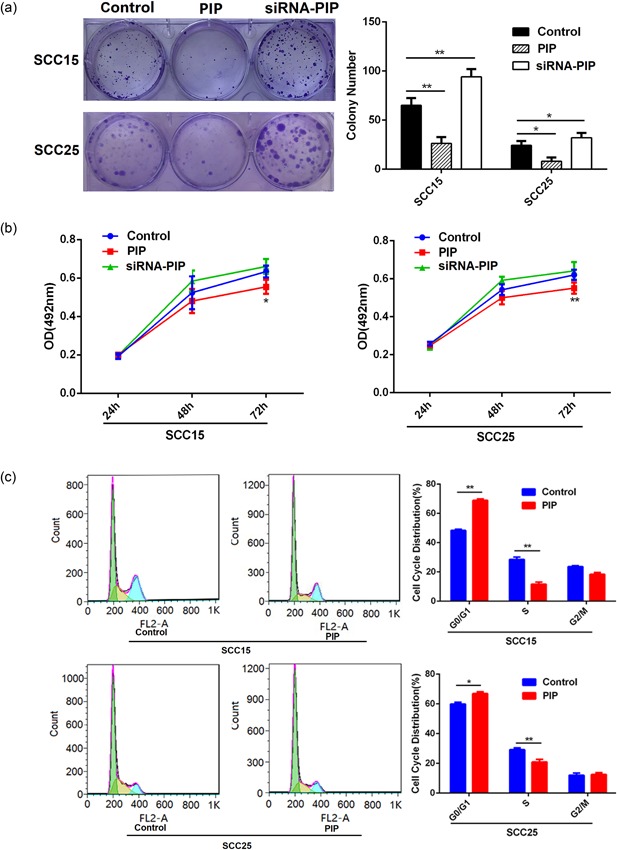
Figure 2.

The growth effects of PIP on human OSCC cell lines. (a) After transfection with control vector, PIP vector or siRNA‐PIP, the image of 500 cells were severally plated in a six‐well plate for 12 days; the average colony number of per well. All data were shown as mean ± SD. *p < 0.05, **p < 0.01. (b) At 24, 48, and 72 hr after transfection with control, PIP vector or siRNA‐PIP, cell proliferation was examined by the MTT assay. All data were shown as mean ± SD. *p < 0.05, **p < 0.01. (c) The relative proportion of SCC15 and SCC25 cell cycle, after transfection with control vector and PIP vector. All data were shown as mean ± SD. *p < 0.05, **p < 0.01. MTT: 3‐(4,5‐Dimethyl‐2‐thiazolyl)‐2,5‐diphenyl‐2H‐tetrazolium bromide; OSCC: oral squamous cell carcinoma; PIP: prolactin‐inducible protein; SD: standard deviation; siRNA: small interfering RNA [Color figure can be viewed at wileyonlinelibrary.com]
