
Figure 7.
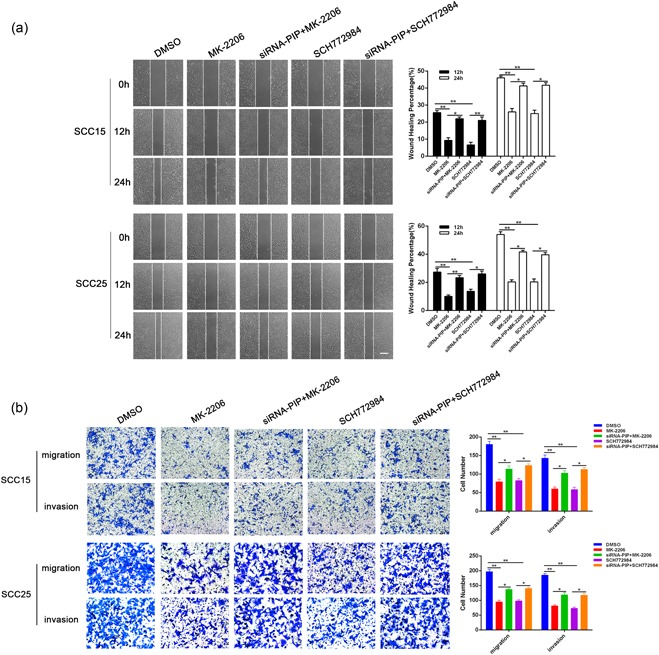
Effects of siRNA‐PIP coculture and AKT/MAPK inhibitor on OSCC migration and invasion. (a) Wound‐healing migration assays; average rates of SCC15 and SCC25 cells migration at 12 and 24 hr after treatment as in Figure 6(a). All data were shown as mean ± SD. *p < 0.05, **p < 0.01. (b) Transwell assays of cells treated as in (a); relative ratio of migrated and invasive cells per field is shown. All data were shown as mean ± SD. *p < 0.05, **p < 0.01. AKT/MAPK: Akt/mitogen‐activated protein kinase; OSCC: oral squamous cell carcinoma; SD: standard deviation; siRNA: small interfering RNA [Color figure can be viewed at wileyonlinelibrary.com]