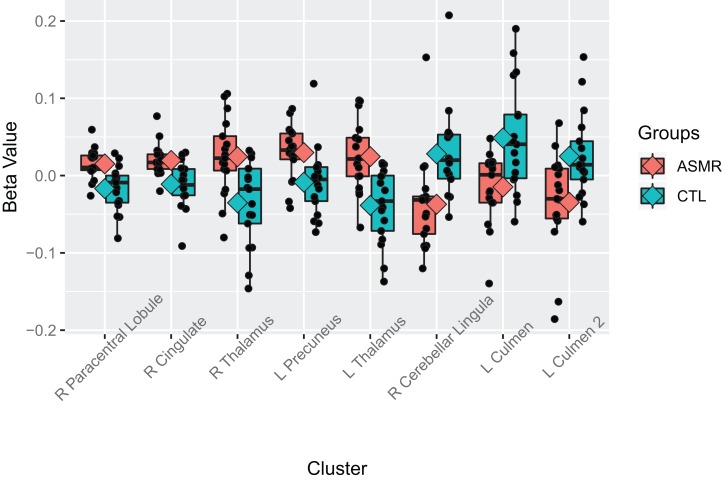
Figure 5. Beta values of the contrast between ASMR participants and control participants while watching the ASMR-eliciting videos.
Beta values for the between-subjects contrasts of ASMR participants as compared to control participants while watching the ASMR-eliciting videos. ASMR participants are depicted in red and control participants in green. The boxes indicate the interquartile medial range for beta values, while whiskers indicate maximum and minimum beta values (excluding outliers). The median beta value is represented by the horizontal line and the mean value by the diamond within each box. Individual beta values per cluster are represented by black circles. The anatomical label for each cluster is shown along the bottom, for reference with Table 3.

