
Figure 1.
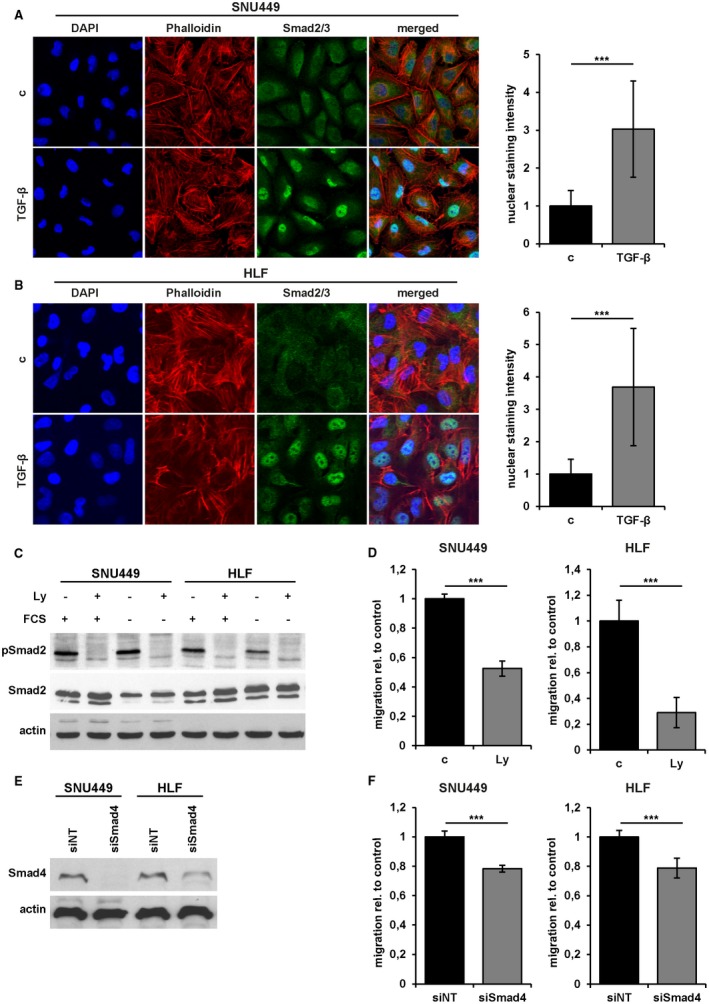
Role of TGF‐β in mesenchymal‐like HCC cells. (A) Left panel: Confocal immunofluorescence analysis of Smad2/3 in SNU449 cells treated with 2.5 ng/mL TGF‐β1 for 15 minutes. Actin stress fibers are indicated by phalloidin staining (red). Nuclei were counterstained with DAPI (blue). Right panel: Quantification of nuclear Smad2/3 signal intensity using ImageJ. (B) Immunofluorescence analysis of HLF cells as described in (A). (C) Western blot analysis of pSmad2 and total Smad2/3, with and without FCS, and interference with 10 µM Ly for 24 hours. Actin was used as loading control. (D) Migrated areas of HLF and SNU449 cells and those treated with 10 µM Ly in wound healing assays. (E) Levels of Smad4 after treatment with siNT or siSmad4. (F) Migrated areas of HLF and SNU449 cells treated with siNT or siSmad4. Data are expressed as mean ± SD. Error bars depict SD from at least three individual experiments. ***P < 0.001. Abbreviations: c, untreated control; FCS, fetal calf serum.