
Figure 3.
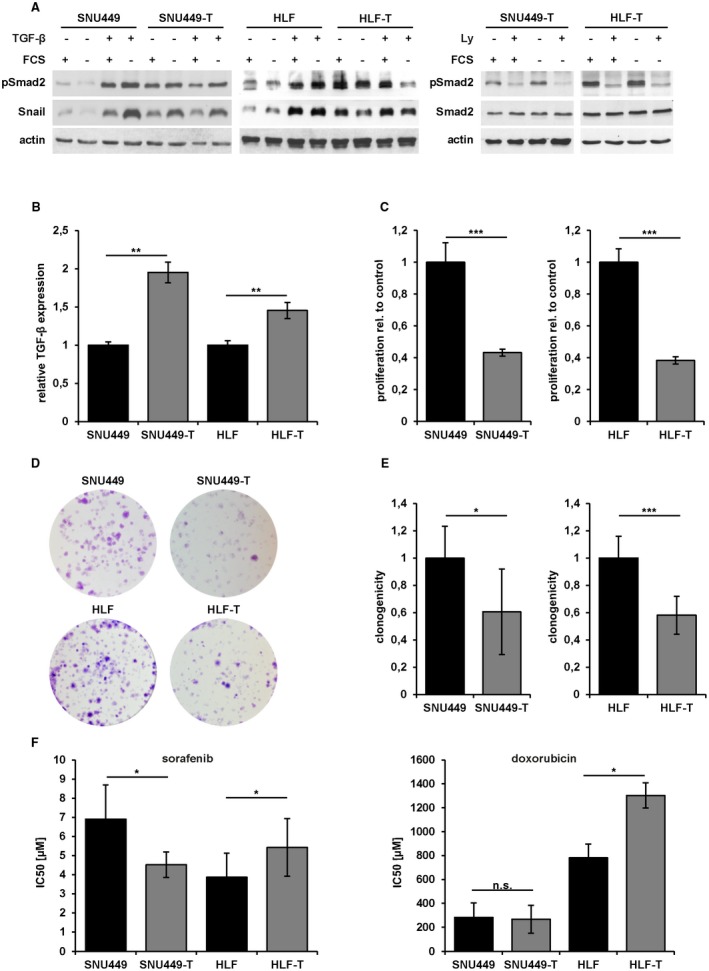
Effects of long‐term TGF‐β exposure on mesenchymal‐like HCC cells. (A) Western blot analysis of pSmad2 and Snail after serum starvation and stimulation with 2.5 ng/mL TGF‐β1 (left panel), and after serum starvation and treatment with 10 µM Ly for 24 hours (right panel). Actin was used as loading control. (B) Analysis of TGF‐β mRNA expression by qPCR. (C) Proliferation kinetics of SNU449/SNU449‐T and HLF/HLF‐T cells over 72 hours. (D) Clonogenic survival assay of SNU449/SNU449‐T (upper panel) and HLF/HLF‐T cells (lower panel) after long‐term treatment with TGF‐β1. Representative images are shown. (E) Quantification of clonogenic survival assay shown in (D). (F) IC50 values [µM] of sorafenib (left panel) and doxorubicin (right panel) in SNU449/SNU449‐T and HLF/HLF‐T cells. Data are expressed as mean ± SD. Error bars depict SD from at least three individual experiments. *P < 0.05, **P < 0.01, ***P < 0.001. Abbreviations: n.s., not significant; qPCR, quantitative reverse‐transcriptase polymerase chain reaction.