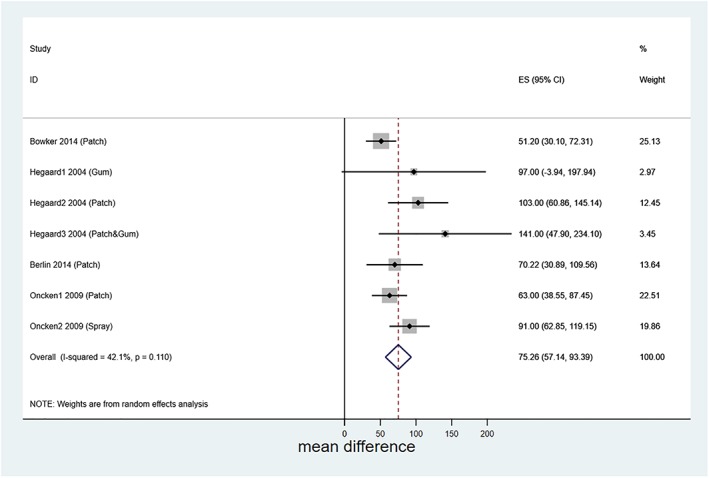
Figure 2.

Forest plot showing meta‐analysis of mean difference in saliva cotinine levels when smoking and when abstinent but using nicotine replacement therapy (NRT). Hegaard1, Hegaard2 and Heggard3 2004 represent cohorts of women given different forms of NRT and reported in Hegaard 2004 29; ditto for Oncken1 and Oncken2 2009 and Oncken 2009 30. [Colour figure can be viewed at wileyonlinelibrary.com]
