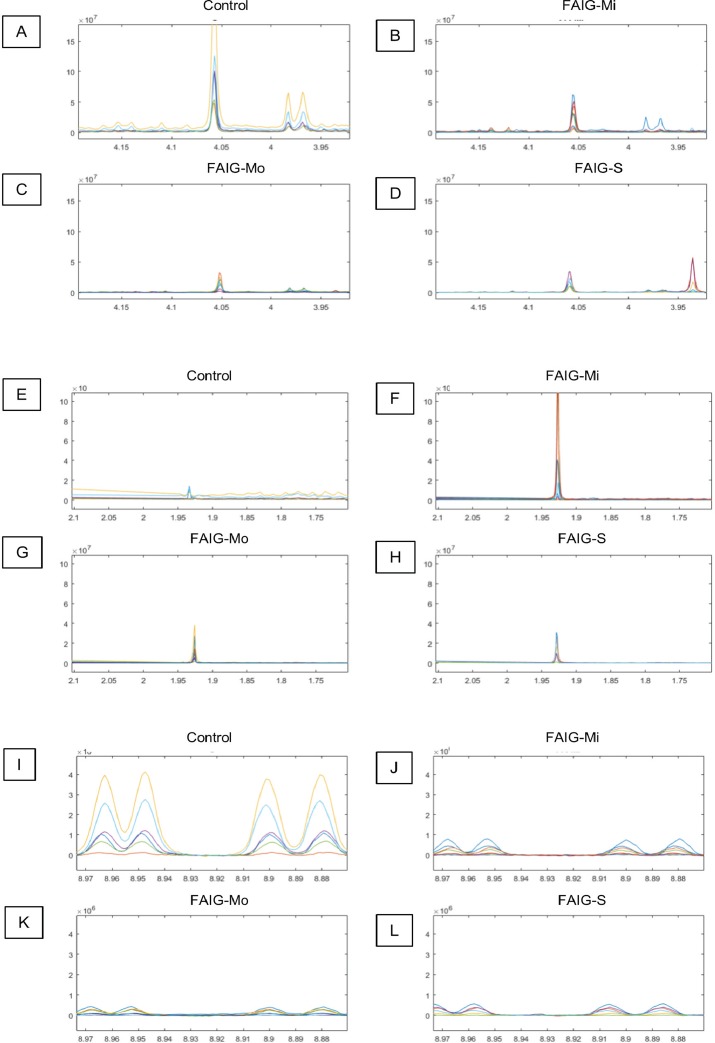
Figure 4. Selected regions of the 1H-NMR spectra of urine from each experimental group.
The singlet of the creatinine signal (4.05 ppm) and the doublet of the signal of hippurate (3.97 ppm) in the (A) Control group, (B) FAIG-Mi, (C) FAIG-Mo, (D) FAIG-S. The acetate singlet (1.92 ppm) in the (E) Control group, (F) FAIG-Mi, (G) FAIG-Mo, (H) FAIG-S. The n-1-methylnicotinamide doublets (8.89 and 8.99 ppm) in the (I) Control group, (J) FAIG-Mi, (K) FAIG-Mo, (L) FAIG-S. Visual differences are clearly detectable.

