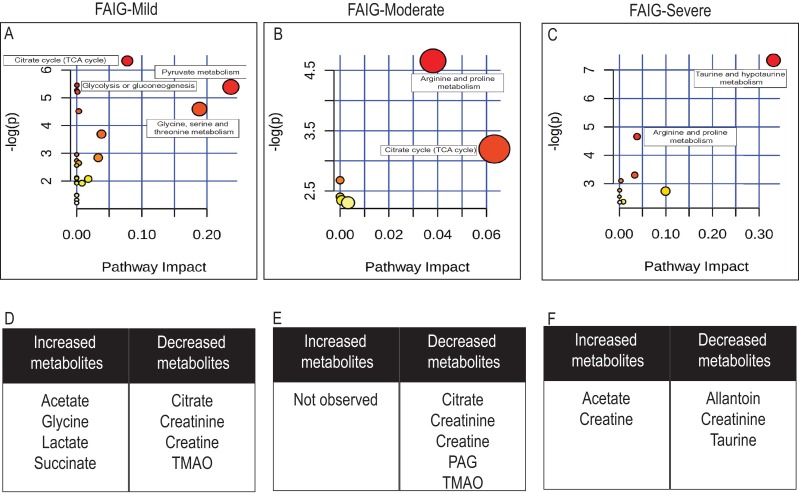
Figure 7. Pathway analysis of identified metabolites in the different groups.
The upper panels (A–C) represent the relevant metabolic pathways on the basis of the urine metabolites of each group using the MetaboAnalyst. The lower tables (D–F) correspond to the metabolites whose NMR signal increased or decreased in comparison to control group. (A) and (D) FAIG-Mi: Mild damage; (B) and (E) FAIG-Mo: Moderate damage; (C) and (F) FAIG-S: Severe damage.

