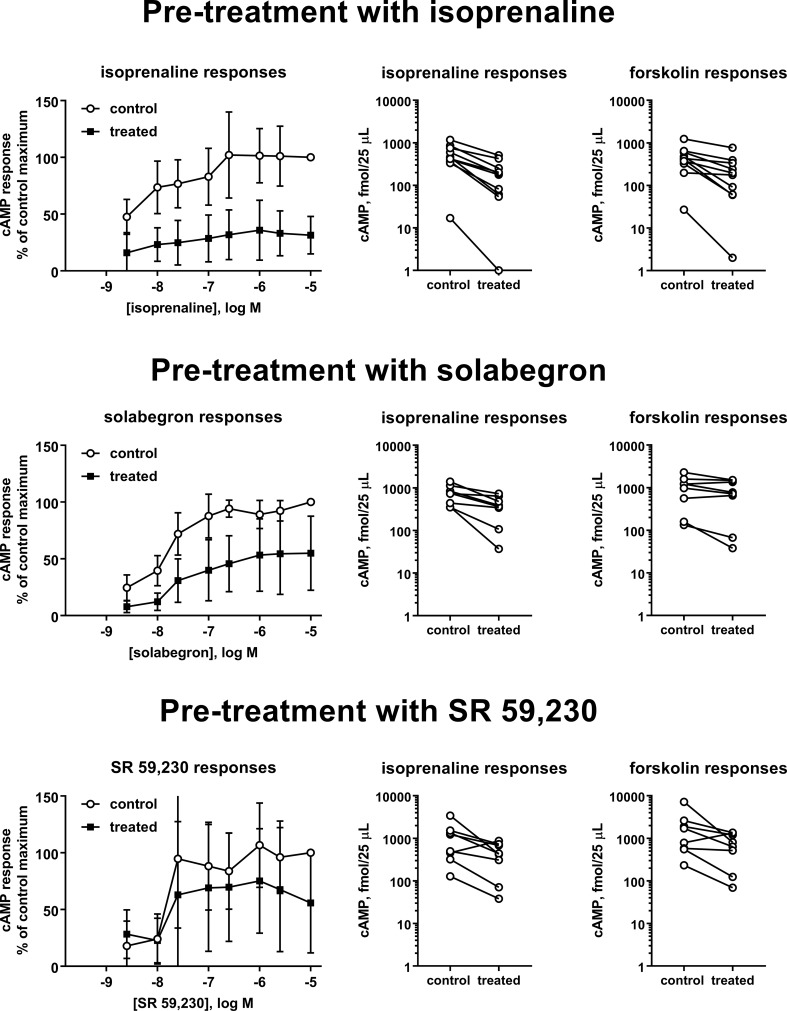
Figure 3.
Effects of a 24 pretreatment with vehicle (control) or isoprenaline (upper panels), solabegron (middle panels), and SR 59,230 (lower panels; 10 µM each) on cAMP accumulation in response to freshly added agonist (left panels), 10 µM isoprenaline (middle panels), or 100 µM forskolin (right panels). Data from the concentration response curves are expressed as % of the response to 10 µM of the agonist in control cells. Paired isoprenaline or forskolin response in cells pretreated with vehicle. Each data point represents one experiment and data from the same experimental day are connected by lines. A quantitative analysis of the data is shown in Tables 1 and 2. The graphical depiction of the concentration-response curves excludes data obtained with 1 nM of ligand because, similar to basal values, many were outside the range of the standard curve and the remaining data points skewed the apparent means for this ligand concentration to higher values.

