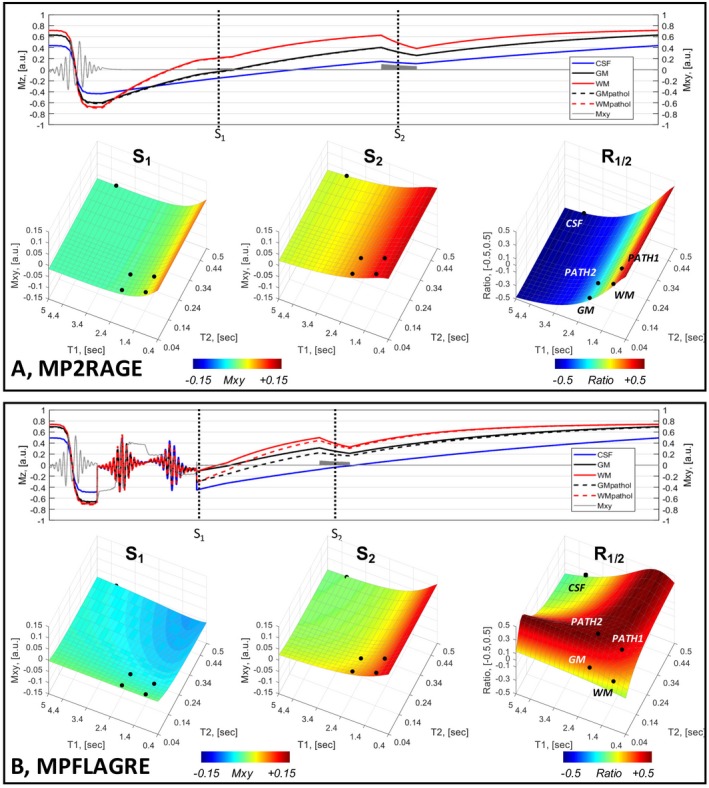
Figure 2.

Bloch simulations of a 2‐block acquisition, S1 and S2. A, Using MP2RAGE parameters (i.e., without a T2 spin‐echo preparation). B, MPFLAGRE‐2 sequence with T2 preparation applied early in the inversion recovery. In both (A) and (B), the time course of Iz amplitudes is shown (5 tissue components: blue, CSF; black, gray matter [GM]; red, white matter [WM] with inversion, pathologic T2). Note that the time axis is not linear, with each unit representing a simulation step. The surface plots of the signal amplitudes are shown over the [T1, T2] parameter space for S1, S2, and the calculated signal R1/2 (using Eqs. (1) and (4)). The MP2RAGE sequence (A) shows only the T1 dependence, whereas the MPFLAGRE‐2 sequence (B) shows the effect of the T2 preparation and T1. The calculated R1/2 shows the CSF suppression and signal detection over the pathologic range of T2. The black dots on the surface plots indicate the 5 tissue components. The T1 and T2 values for CSF are assigned at 4.3 seconds, 0.9 seconds; GM at 2.0 seconds, 60 ms; and WM at 1.2 seconds, 60 ms19, 20, 21
