Figure 3.

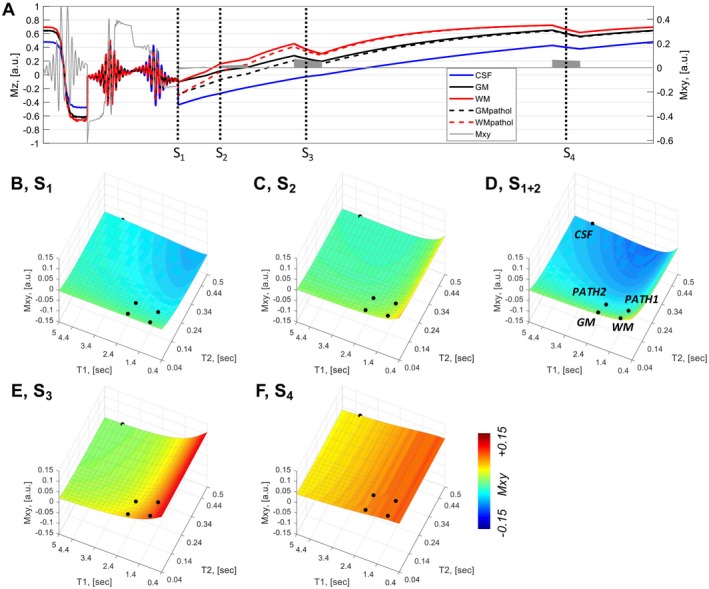
Bloch simulations of a 4‐block acquisition. A, Time course of Iz amplitudes (5 tissue components: blue, CSF; black, GM; red, WM; GM and WM with long T2 values for pathology). The [T1, T2] values for CSF are assigned at 4.3 seconds, 0.9 seconds; GM at 2.0 seconds, 60 ms; and WM at 1.2 seconds, 60 ms. B, Signal block 1 intensity is strongly T2 weighted, shown over the T1, T2 parameter space. C, Signal block 2 intensity. D, Summed signal blocks 1+2 show the combined T1 and T2 sensitivity. E,F, Signal blocks 3 and 4 are strongly influenced by T1. All signal intensities are plotted on a scale of [−0.1, 0.1]
