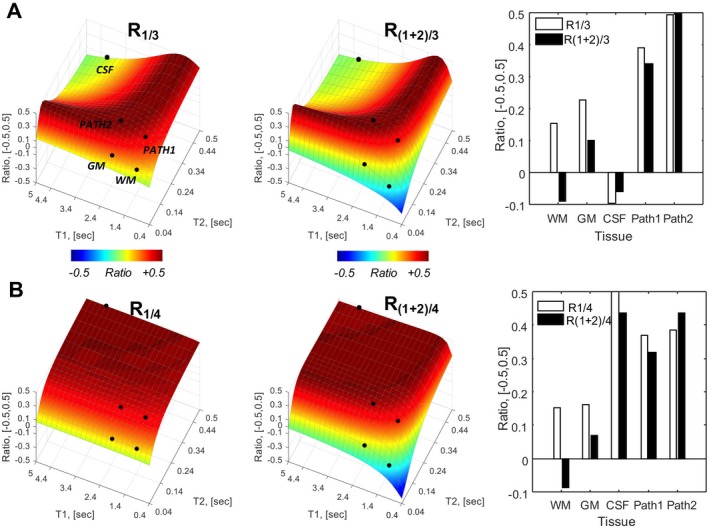
Figure 4.

Bloch simulations for the MPFLAGRE‐4 sequence, adding a delayed S4 block. See Figure 3A for the time course. Behavior of 5 tissue components identified CSF (blue), GM (black), and WM (red); and GM and WM with long T2 values for pathology. Calculated R intensities are shown: R1/3 and R(1+2)/3 intensities as a function of T1, T2 space (A) and plots of signal amplitude from the 5 tissue points (far right). B, The R1/4 and R(1+2)/4 intensities. The R1/3, R(1+2)/3 amplitudes show CSF suppression and increased amplitudes over long T2 components. The R1/4 amplitude shows predominantly T2 dependence. The R(1+2)/4 intensity, similar to R(1+2)/3, shows a larger dynamic range for T2 dependence
