
Figure 3.
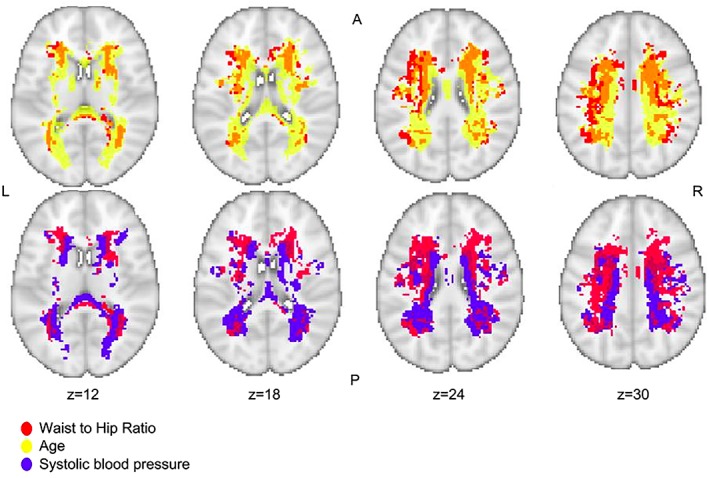
Relation between regional white matter hyperintensity probability and higher waist‐to‐hip ratio (linear, red), higher systolic blood pressure (linear, blue), and higher age (exponential, yellow; TFCE, p < 0.05, FWE corrected). This figure is layered on a T1‐weighted image (coordinates according to the MNI125 template); A = anterior; L = left; R = right; P = posterior; n = 1,825. FWE = family‐wise error; TFCE, threshold‐free cluster enhancement.