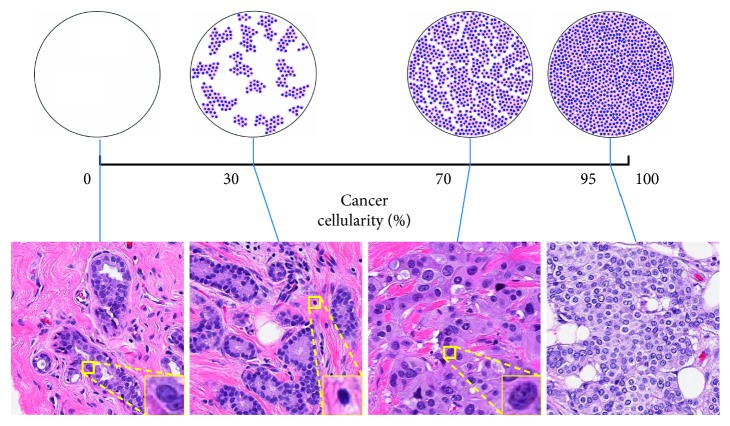
Figure 1.
Illustrations of the definition of cellularity. In the top row are 4 computer generated diagrams [6] used as reference for manual estimation. In the bottom row are 4 example patches from the test set labeled with manually estimated cellularity and 3 zooming windows showing the morphology of benign epithelial, lymphocyte, and malignant epithelial nuclei.

