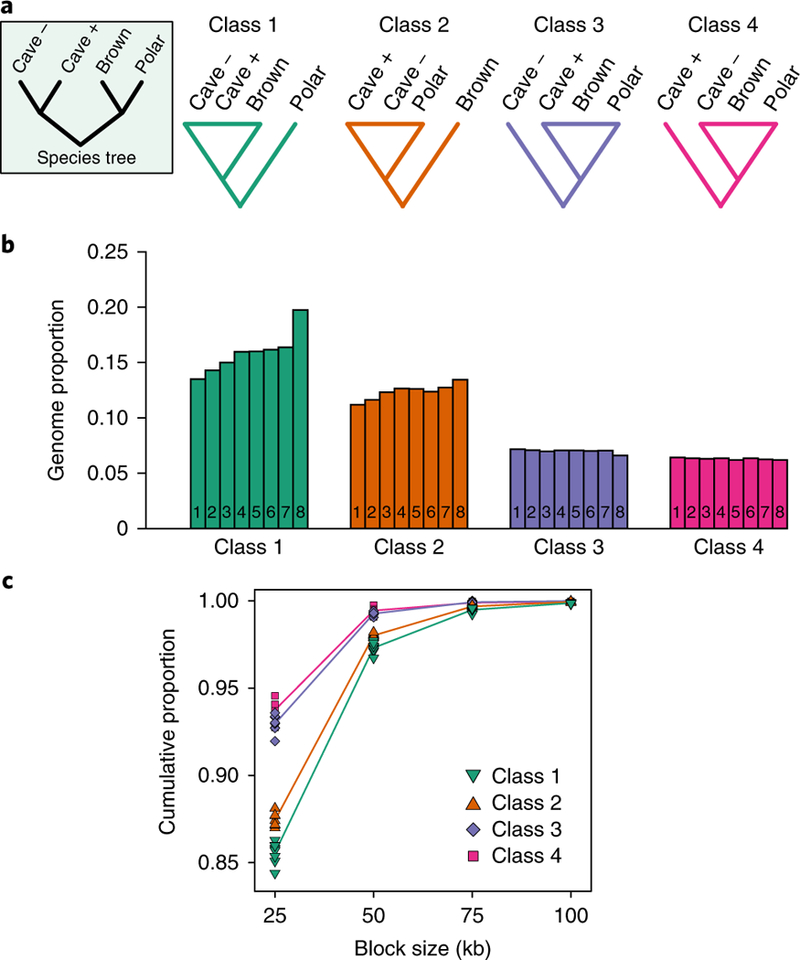
Fig. 3 |. Test of gene flow direction based on the distribution of rooted tree topologies along a non-overlapping 25 kb sliding window.

Five individuals are used in the test: a brown bear, a polar bear, the least admixed Caucasus cave bear (kudarensis, ‘cave –’), a more admixed European cave bear (spelaeus, ‘cave +’) and the Asiatic black bear outgroup. a, The symmetrical rooted ingroup species tree and the four alternative classes of topology that are informative on gene flow directionality. b, The proportion of 25 kb genomic blocks returning each topology class for eight brown bears, each represented by individual numbered bars: 1, Alaska (ABC Islands), North America; 2, Alaska (Denali), North America; 3, Russia; 4, Slovenia; 5, Sweden; 6, Georgia; 7, Spain; 8, Late Pleistocene Austria. The results support bidirectional gene flow among cave bears and brown bears: overrepresentation of topology class 1 relative to class 2 for all brown bears investigated indicates gene flow from cave bears into brown bears, and overrepresentation of topology class 3 relative to class 4 indicates gene flow in the opposite direction, from the brown/polar bear lineage into the more admixed cave bear. c, The cumulative size distributions of regions returning each topology class, determined by counting the number of consecutive 25 kb blocks returning the same topology. Absolute counts are provided in Supplementary Table 5. Individual points represent the cumulative proportions for individual brown bears. For the purpose of visualization, average cumulative proportions for each topology class are shown as coloured lines centred on the mean proportion observed for each block size and linked by linear interpolation.
