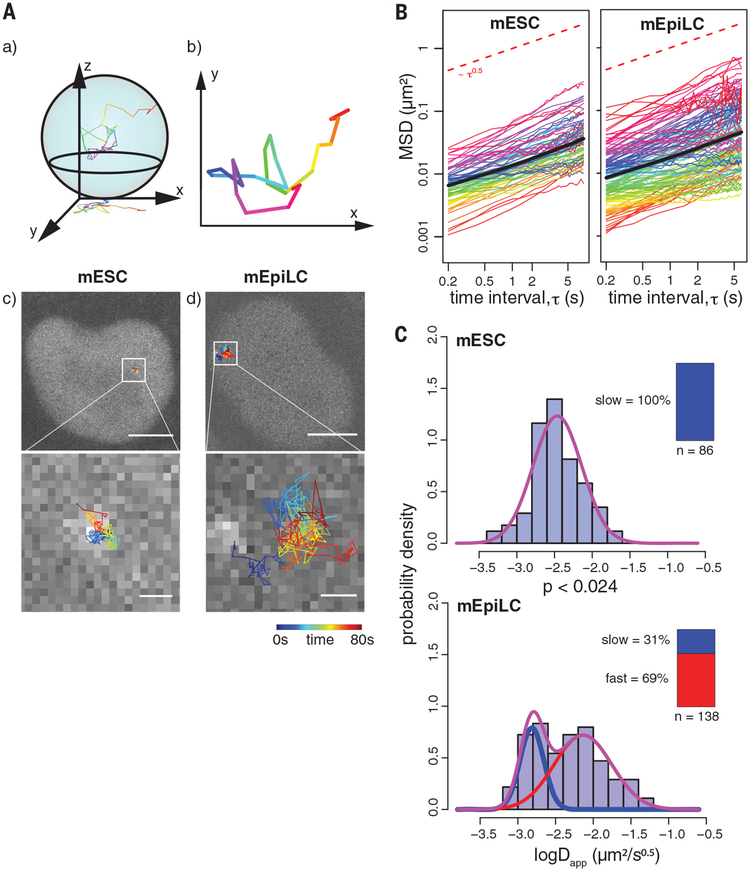
Fig. 2. Live-cell CARGO-dCas9 imaging and tracking of the Fgf5 enhancer during differentiation of mESCs to mEpiLCs.
(A) Live-cell two-dimensional (2D) tracking of the CARGO-dCas9–labeled Fgf5 enhancer in mESCs and mEpiLCs. (a and b) Movies of the cell nuclei are recorded as 2D projections of the 3D movement of the labeled loci. (c and d) Representative images of a single mESC (c) or mEpiLC (d) nucleus, overlaid with recorded trajectories color-coded by time (0 to 80 s). The bottom panels show zoomed-in views of the inset areas in the top images. Scale bars, 5 mm (top); 500 nm (bottom). (B) Subdiffusive motion of the Fgf5 enhancer locus. tMSD for each tracked enhancer allele (colored curves) and eMSD (bold black curve, shaded area indicates ± SEM) as a function of the time interval (t) between observations. Ninety-one and 130 observed alleles are plotted for the mESC and mEpiLC state, respectively. The red dashed reference line has a slope of 0.5. (C) Appearance of a fast-moving Fgf5 enhancer population in the mEpiLC state. Histograms of fitted apparent anomalous diffusion coefficients calculated from tMSD trajectories in mESCs or mEpiLCs, as indicated, are overlaid with fitted Gaussian mixture distribution curves in purple. Individual slow and fast components are plotted as blue and red curves, respectively. The inset bar plots indicate the number of recorded trajectories, together with the mixing proportion of slow and fast population components for each individual Gaussian. Bayesian information criterion (BIC) values for different component fittings are listed in table S1. The difference in distributions is supported by a two-sample Kolmogorov-Smirnov test.

