

Abstract
Purpose
We aimed to investigate the association between serum uric acid (SUA) levels and obstructive sleep apnea-hypopnea syndrome (OSAHS) in patients with type 2 diabetes.
Methods
A cross-sectional study of 212 type 2 diabetes mellitus (T2DM) patients was conducted in Xiamen, China. All patients underwent polysomnography (PSG) recordings for OSAHS diagnosis. Patients were grouped according to the apnea-hypopnea index (AHI) as mild (5-14.9), moderate (15-29.9), and severe (≧30) OSAHS. Patients with AHI ≤ 4.9 served as the control group. Weight, body mass index (BMI), SUA, liver function, renal function, blood pressure, lipid profiles, and glycemic parameters were measured.
Results
A total of 158 patients (101 men and 57 women) with complete data were analyzed in this study. 127 patients were identified as OSAHS. Among the 127 patients with OSAHS, 56 (44.1%), 37 (29.1%), and 34 (26.8%) had mild, moderate, and severe OSAHS, respectively. Correlation analyses showed that the SUA level was significantly related to the apnea-hypopnea index (AHI) (r = 0.194, p = 0.016). The level of SUA was significantly higher among OSAHS patients compared to the control group (control group: 333.14 ± 80.52 μmol/L, mild group: 345.50 ± 90.27 μmol/L, moderate group: 363.59 ± 134.26 μmol/L, and severe group: 428.37 ± 123.58 μmol/L and p = 0.029). Multivariable logistic regression analyses showed that SUA was the independent risk factor for OSAHS (OR: 1.006, 95% CI: 1.001-1.011, p = 0.020).
Conclusions
The SUA level is significantly associated with the severity of OSAHS and should be controlled when managing OSAHS.
1. Introduction
In recent decades, serum uric acid (SUA), which is the end product of purine metabolism in humans, has been consistently found to predict the development of metabolic syndrome (MetS) [1, 2]. Growing epidemiological studies suggested that hyperuricemia might be one component of MetS [3]. Previous studies suggested that the SUA level may be a useful predictor for metabolic disorders [4]. With the increase of SUA levels, the prevalence of obesity significantly increased. The SUA level is independently related to obesity in type 2 diabetes mellitus (T2DM) even after adjusting for other obesity risk factors [5, 6].
Obstructive sleep apnea-hypopnea syndrome (OSAHS) is a syndrome characterized by recurrent episodes of shallow or paused breathing during sleep and normally leads to intermittent hypoxia (IH) and sleep disruption due to partial or complete obstructions of the upper airway during sleep. OSAHS affects 3-7% of men and 2-5% women in the general population [7]. OSAHS becomes a major public health burden and is associated with important medical consequences. A large body of evidence has identified OSAHS as an independent risk factor for cardiovascular morbidity [8]. Increasing evidence also demonstrates the close association between obesity and OSAHS [9]. Obesity is a major pathogenetic factor for OSAHS [10].
Previous studies observed an association between SUA levels and OSAHS. In a population-based survey study, a strong association was found between SUA and OSAHS even after adjustment for confounding factors such as gender, age, and BMI [11]. In a large set of OSAHS patients without known comorbidities, SUA is also independently associated with OSAHS severity [12]. Kanbay et al. found that hyperuricemia (HUA) is significantly associated with cardiovascular disease in patients with OSAHS even after adjusting for traditional risk factors for cardiovascular disease [13]. Kosacka et al. found that OSAHS patients with increased SUA concentration have a higher risk of atherosclerosis and a higher prevalence of cardiovascular events [14]. However, among the individuals with T2DM, the relationship between the SUA levels and the severity of OSAHS remained unclear. So, the current study is aimed at exploring whether the SUA level was significantly associated with OSAHS in T2DM patients.
2. Methods
2.1. Ethics Statement
The study was approved by the Human Research Ethics Committee of the Xiamen First Hospital. All subjects provided written informed consent.
2.2. Participants
A total of 212 adult subjects with T2DM were recruited from the First Affiliated Hospital, Xiamen University, China, from June 2015 to June 2017. These subjects underwent face-to-face interview with uniform questionnaires. Subjects were admitted for routine check-up evaluations and underwent a detailed physical examination and overnight polysomnography (PSG). Exclusion criteria included the presence of hyperthyroidism or hypothyroidism, acute illnesses, serious heart diseases, uncontrolled hypertension, presence of cancer, craniofacial abnormalities, any respiratory disorder other than OSAHS, and current use of hypnotics or any treatment for breathing disorders. Among the eligible patients, 36 subjects were excluded because of the deficiency of SUA data. 18 patients with the creatinine level over 104 μmol/L were further excluded from the study. The remaining 158 patients (101 men and 57 women) were left for analyses. The flow diagram is shown in Figure 1.
Figure 1.
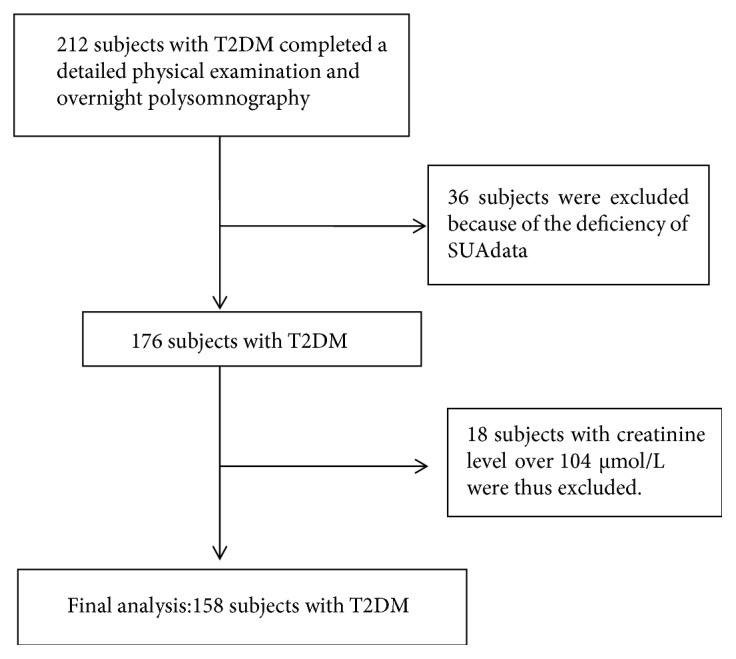
Flow diagram.
2.3. Anthropometric and Biochemical Measurements
Anthropometric measurements include body weight, height, waist circumference (WC), blood pressure (BP), body mass index (BMI), and neck circumference (NC). NC was measured at the middle of the neck between the midcervical spine and the midanterior neck 0.5 cm below the laryngeal prominence. BMI was calculated as the weight in kilograms divided by the square of the height in meters. WC was measured at the midpoint between the inferior costal margin and the superior border of the iliac crest on the midaxillary line. Weight and height were measured with light clothes and without shoes to the nearest 0.1 kg and 0.5 cm, respectively.
All blood samples were obtained after 12-hour fasting. Blood samples were tested in the central laboratory of the First Affiliated Hospital, Xiamen University, as described in details previously [15]. Briefly, triglyceride (TG), total cholesterol (TC), high-density lipoprotein cholesterol (HDL-c), low-density lipoprotein cholesterol (LDL-c), aspartate aminotransferase (AST), and alanine aminotransferase (ALT) were determined on a HITACHI 7450 analyzer (HITACHI, Tokyo, Japan). Serum creatinine (Scr) and SUA were measured with an autoanalyzer (COBAS INTEGRA 400 plus, Roche, Basel, Switzerland). Serum fasting C peptide was measured by electrochemiluminescence immunoassay (Elecsys, Roche), and hemoglobin A1c (HbA1c) were measured by the Bio-Rad VARIANT Hemoglobin A1c assay. HUA was defined as the serum uric acid level > 7.0 mg/dL in males and >6.0 mg/dL in females [15].
2.4. Polysomnography
Polysomnography (PSG) is the gold standard method for diagnosing and assessing the severity of OSAHS. All patients underwent an overnight PSG study performed from 11:00 pm to 7:00 am according to standard techniques with monitoring of the electroencephalogram (EEG), electrooculogram (EOG), electromyogram (EMG), flow, thoracic and abdominal respiratory effort, oximetry, and body position. All PSG data were collected and stored using an E-Series digital system (Compumedics Ltd., Australia). Polysomnographic recordings were interpreted in accordance with the current American Academy of Sleep Medicine (AASM) guidelines [16]. The recording duration ≥ 5 h was required for validation, and monitoring was repeated on a second night if subjective sleep latency exceeded 2 h on the first night or if respiratory parameters were missing. Polysomnographic records were scored according to standard criteria. The apnea-hypopnea index (AHI) was defined as the total number of obstructive apnea and hypopnea per hour of sleep, and the severity of OSAHS was determined by AHI. Absence of OSAHS or mild, moderate, and severe degrees were defined by an AHI of ≤4.9, AHI of ≤5-14.9, AHI of ≤15-29.9, and AHI of ≧30 events/hour, respectively [17].
2.5. Statistical Analysis
Data were analyzed with the use of IBM SPSS Statistics 21.0. Results are expressed as mean ± standard deviation (SD). Differences between groups were analyzed using ANOVA or the Mann-Whitney U test for continuous variables and the chi-square test for categorical variables. The correlation of SUA with AHI was analyzed using Pearson's correlation analysis. Multivariable logistic regression analysis was used to calculate the odds ratio (OR) for OSAHS in different models with adjustment for potential confounders. In model 1, no variables were adjusted for. In model 2, age, sex, BMI, and the waist/hip were adjusted for. In model 3, hypertension and dyslipidemia plus model 2 were adjusted for. All p values presented are two-tailed, and values less than 0.05 are considered statistically significant.
3. Results
The baseline characteristics of the studied subjects are shown in Table 1. The mean age of the participants was 51.55 ± 13.43 years. The average BMI, WC, and HbA1c were 28.30 ± 4.85 kg/m2, 0.97 ± 0.09 m, and 9.88 ± 2.45%, respectively. The overall prevalence rate of OSAHS was 80.37% in type 2 diabetes mellitus patients in the current cohort. Among the 127 patients with OSAHS, 56 (44.1%), 37 (29.1%), and 34 patients (26.8%) presented mild, moderate, and severe OSAHS, respectively. Comparing between the four groups (ordering as none, mild, moderate, and severe OSAHS), there were significant increases in BMI (27.29 ± 4.51 kg/m2, 26.21 ± 3.50 kg/m2, 28.97 ± 5.56 kg/m2, and 31.76 ± 4.25 kg/m2, respectively, p < 0.05), NC (38.68 ± 3.79 cm, 38.15 ± 3.17 cm, 40.12 ± 4.03 cm, and 42.48 ± 3.22 cm, respectively, p < 0.05), and SUA (333.14 ± 80.52 μmol/L, 345.50 ± 90.27 μmol/L, 363.59 ± 134.26 μmol/L, and 428.37 ± 123.58 μmol/L, respectively, p = 0.029). Pearson's correlation coefficients with adjustment for gender, age, and BMI are shown in Figure 2 and show that serum SUA levels were positively correlated with AHI (r = 0.194, p = 0.016).
Table 1.
Characteristics of the control group and mild, moderate, and severe OSAHS groups stratified by the apnea-hypopnea index (AHI).
| AHI ≤ 4.9 | AHI ≤ 5~14.9 | AHI ≤ 15~29.9 | AHI ≥ 30 | p value | |
|---|---|---|---|---|---|
| No. | 31 | 56 | 37 | 34 | — |
| Gender (male/female) | 19/12 | 34/22 | 21/16 | 27/7 | 0.251 |
| Age (years) | 44.87 ± 13.97 | 54.59 ± 11.63 | 54.00 ± 14.49 | 50.03 ± 12.63 | 0.018 |
| BMI (kg/m2) | 27.29 ± 4.51 | 26.21 ± 3.50 | 28.97 ± 5.56 | 31.76 ± 4.25 | ≤0.001 |
| Waist/hip | 0.94 ± 0.06 | 0.96 ± 0.11 | 0.98 ± 0.07 | 0.99 ± 0.06 | 0.391 |
| NC (cm) | 38.68 ± 3.79 | 38.15 ± 3.17 | 40.12 ± 4.03 | 42.48 ± 3.22 | 0.003 |
| T2DM (years) | 3.47 ± 5.42 | 8.07 ± 6.99 | 5.18 ± 6.22 | 4.82 ± 5.90 | 0.099 |
| Systolic BP (mmHg) | 124.06 ± 17.27 | 130.02 ± 15.63 | 130.41 ± 13.75 | 134.20 ± 20.09 | 0.452 |
| Diastolic BP (mmHg) | 77.39 ± 8.55 | 76.14 ± 11.06 | 79.16 ± 9.29 | 80.11 ± 11.31 | 0.804 |
| SUA (μmol/L) | 333.14 ± 80.52 | 345.50 ± 90.27 | 363.59 ± 134.26 | 428.37 ± 123.58 | 0.029 |
| C peptide (ng/mL) | 1.15 ± 0.68 | 1.22 ± 0.81 | 1.73 ± 1.11 | 2.37 ± 2.30 | 0.024 |
| HbA1c (%) | 10.81 ± 2.37 | 10.02 ± 2.50 | 9.96 ± 2.40 | 8.79 ± 2.19 | 0.049 |
| HDL-c (mmol/L) | 1.07 ± 0.23 | 1.08 ± 0.19 | 1.06 ± 0.23 | 1.01 ± 0.22 | 0.793 |
| LDL-c (mmol/L) | 3.36 ± 0.89 | 2.96 ± 0.99 | 3.11 ± 1.11 | 3.07 ± 1.01 | 0.480 |
| Triglyceride (mmol/L) | 1.77 ± 1.13 | 2.36 ± 2.30 | 2.31 ± 1.53 | 2.09 ± 1.23 | 0.935 |
| TC (mmol/L) | 5.26 ± 1.06 | 5.59 ± 3.4 | 5.30 ± 1.11 | 5.03 ± 1.07 | 0.552 |
| AST (U/L) | 23.60 ± 17.96 | 19.54 ± 13.01 | 23.64 ± 15.22 | 22.49 ± 8.54 | 0.630 |
Data was expressed as mean ± SD; BMI: body mass index; NC: neck circumference; SUA: serum uric acid; HDL-c: high-density lipoprotein cholesterol; LDL-c: low-density lipoprotein cholesterol; HbA1c: hemoglobin A1c; TC: total cholesterol; AST: aspartate aminotransferase.
Figure 2.
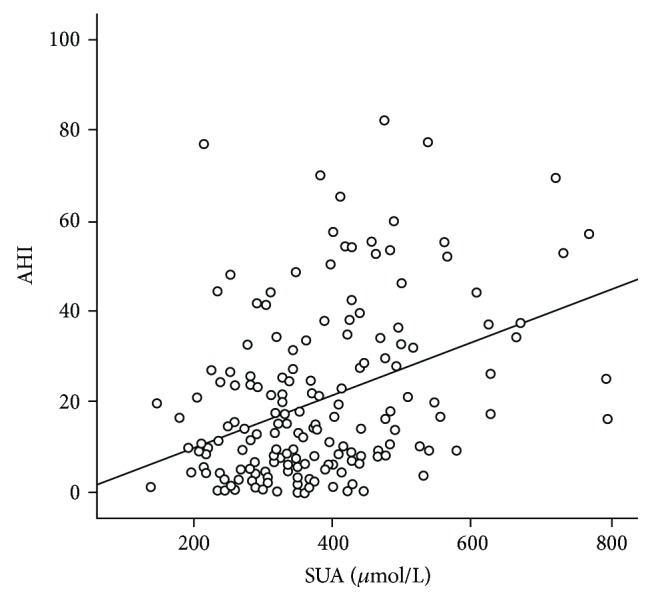
Correlations of SUA levels with AHI in the subjects.
Table 2 shows the characteristics of the subjects stratified by hyperuricemia. Subjects with hyperuricemia had significantly higher BMI (30.28 ± 5.95 kg/m2 vs. 27.36 ± 3.90 kg/m2, p = 0.002) and TG (2.67 ± 2.16 mmol/L vs. 1.94 ± 1.43 mmol/L, p = 0.027) levels compared with the control groups.
Table 2.
Characteristics of the subjects stratified by hyperuricemia.
| HUA | NUA | p value | |
|---|---|---|---|
| Gender (male/female) | 70/22 | 31/35 | 0.324 |
| Age (years) | 47.66 ± 15.28 | 53.66 ± 11.95 | 0.008 |
| BMI (kg/m2) | 30.28 ± 5.95 | 27.36 ± 3.90 | 0.002 |
| Waist/hip | 0.96 ± 0.07 | 0.97 ± 0.09 | 0.386 |
| Neck circumference (cm) | 39.99 ± 4.13 | 39.45 ± 3.72 | 0.496 |
| Duration of T2DM (years) | 5.12 ± 6.41 | 6.17 ± 6.48 | 0.334 |
| Systolic BP (mmHg) | 130.75 ± 15.43 | 128.88 ± 16.65 | 0.494 |
| Diastolic BP (mmHg) | 80.40 ± 10.13 | 76.35 ± 9.44 | 0.014 |
| C peptide (ng/mL) | 1.82 ± 1.15 | 1.45 ± 1.44 | 0.136 |
| HbA1c (%) | 9.44 ± 2.30 | 10.15 ± 2.47 | 0.087 |
| HDL-c (mmol/L) | 1.02 ± 0.189 | 1.08 ± 0.218 | 0.081 |
| LDL-c (mmol/L) | 2.95 ± 1.08 | 3.16 ± 0.97 | 0.223 |
| Triglyceride (mmol/L) | 2.67 ± 2.16 | 1.94 ± 1.43 | 0.028 |
| Total cholesterol (mmol/L) | 5.25 ± 1.18 | 5.38 ± 2.57 | 0.709 |
| AST (U/L) | 24.46 ± 14.41 | 20.73 ± 13.51 | 0.113 |
Data was expressed as mean ± SD; BMI: body mass index; HDL-c: high-density lipoprotein cholesterol; LDL-c: low-density lipoprotein cholesterol; HbA1c: hemoglobin A1c; AST: aspartate aminotransferase; HUA: hyperuricemia; NUA: normal serum uric acid.
Table 3 shows the adjusted ORs with associated 95% confidence interval (CI) of OSAHS by using multivariable logistic regression. Model 1 is a univariable model. In model 2, the confounding factors of age, sex, BMI, and the waist/hip ratio were adjusted for. In model 3, the confounding factors of age, sex, BMI, the waist/hip ratio, hypertension, and dyslipidemia were adjusted for. In all 3 models, SUA was significantly associated with OSAHS. In model 3, the adjusted OR with associated 95% CI of SUA with OSAHS was 1.006 (1.001–1.011; p < 0.01).
Table 3.
To investigate the role of SUA in predicting OSAHS, logistic regression was performed.
| OR | CI (95%) | p value | |
|---|---|---|---|
| Model 1 | 1.005 | 1.001-1.009 | 0.014 |
| Model 2 | 1.006 | 1.001-1.011 | 0.013 |
| Model 3 | 1.006 | 1.001-1.011 | 0.020 |
Model 1: crude model; model 2: adjusted for age, sex, BMI, and waist/hip; model 3: adjusted for age, sex, BMI, waist/hip, hypertension, and dyslipidemia.
4. Discussion
The study showed a significant association between SUA and OSAHS in the patients with T2DM. The results suggested that type 2 diabetic patients with OSAHS had significantly higher levels of SUA than those without OSAHS (428.37 ± 123.58 μmol/L vs. 333.14 ± 80.52 μmol/L, p = 0.029). Furthermore, the SUA level was significantly correlated to the severity of OSAHS, with the Pearson's correlation coefficients between SUA levels and AHI of 0.194 (p = 0.016). With adjustment for potential confounding factors such as gender, age, and BMI, logistic regression analysis showed that SUA was independently associated with risk of OSAHS in patients with T2DM.
Similar to our data, a previous study found that after adjustment for confounding factors such as gender, age, BMI, social class, ethnicity, cholesterol, triglycerides, blood pressure, and glucose, the patients with OSAHS had higher levels of SUA than those without OSAHS [11]. It showed that OSAHS was also independently associated with increased risk of SUA. An increase in 1 μmol/L in the SUA level was associated with 16% increased risk of OSAHS (95% CI = 1.01-1.33). The OR is higher than we found in the current study, likely due to the different populations studied. In our study, we had excluded the patients with the serum creatinine level over 104 μmol/L and all the subjects were type 2 diabetes mellitus patients.
Over the past few decades, hyperuricemia has been found to be a risk factor for atherosclerosis and hypertension [18]. One of the mechanisms is the oxidative stress [19]. The epidemic of hyperuricemia, obesity, and cardiovascular and cerebrovascular diseases has cast a heavy burden on the world [20, 21]. Also, a large body of evidence has identified that increasing SUA levels could be associated with MetS [22, 23]. In a previous study, Liu et al. [15] found that an increased SUA level was significantly related with increased prevalence rates of insulin resistance and MetS. In a recent study, Li et al. found that BMI significantly increased with the increase of SUA levels in T2DM [24].
In the clinic, obesity is associated with insulin resistance and increases the risk for type 2 diabetes [25]. But there is no consensus for a unifying mechanism of insulin resistance. Of all possible mechanisms, inflammation has been the major concept. Obesity contributes to the initiation of chronic inflammation, and inflammation inhibits the insulin signaling activity in hepatocytes and adipocytes [26]. Another cross-sectional study with larger samples shows that the systemic inflammation including high-sensitivity C-reactive protein (hs-CRP), fibrinogen, erythrocyte sedimentation rate (ESR), and SUA significantly increases in OSAHS patients without known comorbidities and correlates with OSA severity [12].
It was well known that obese individuals present higher incidence of OSAHS, which contributes to increased morbidity and mortality [27, 28]. There is a strong relationship between obesity and OSAHS [29]. A previous study suggests that, in obese individuals, OSAHS is independently associated with inflammation and insulin resistance [30]. So our data indicate that the increased SUA level was an independent risk factor for the severity of OSAHS, possibly by insulin resistance. But it needs more studies to validate the hypothesis.
Our study also had a few limitations. First, the causal relationship between SUA and OSAHS could not be determined because of the cross-sectional study design. Second, the number of patients in this study was relatively small; therefore, our results should be confirmed in future prospective cohort studies with larger sample sizes. Third, the present subjects were not randomly sampled and the selection bias was obvious, so our results should be interpreted with much caution.
5. Conclusion
The SUA level is significantly associated with the severity of OSAHS and should be considered in OSAHS management in the clinic.
Acknowledgments
This study was supported by the Fujian Provincial Natural Science Foundation of China (No. 2015J01558, No. 2015J01555) and the Xiamen Scientific Programs (No. 3502Z20154010) in China.
Data Availability
The data used to support the findings of this study are available from the corresponding author upon reasonable request.
Ethical Approval
All procedures performed in studies involving human participants were in accordance with the ethical standards of the institutional and/or national research committee and with the 1964 Helsinki Declaration and its later amendments or comparable ethical standards.
Disclosure
The corresponding author had full access to all the data in the study and had final responsibility for the decision to submit for publication.
Conflicts of Interest
The authors declare that they have no conflict of interest.
Authors' Contributions
C.Z. performed the statistical analysis and wrote the manuscript; C.Z., H.S., S.W., J.L., T.L., C.D., H.X., Z.C., and S.Z. participated in the data collection; Z.L., X.L., and C.L. contributed to the discussion; C.L. participated in the design of the study and edited the manuscript. All authors have read and approved the final manuscript. Caiyu Zheng and Haiqu Song contributed equally to this work.
References
- 1.Liu M., He Y., Jiang B., et al. Association between serum uric acid level and metabolic syndrome and its sex difference in a Chinese community elderly population. International Journal of Endocrinology. 2014;2014:11. doi: 10.1155/2014/754678.754678 [DOI] [PMC free article] [PubMed] [Google Scholar]
- 2.Richette P., Bardin T. Gout. The Lancet. 2010;375(9711):318–328. doi: 10.1016/S0140-6736(09)60883-7. [DOI] [PubMed] [Google Scholar]
- 3.Nejatinamini S., Ataie-Jafari A., Qorbani M., et al. Association between serum uric acid level and metabolic syndrome components. Journal of Diabetes and Metabolic Disorders. 2015;14(1):p. 70. doi: 10.1186/s40200-015-0200-z. [DOI] [PMC free article] [PubMed] [Google Scholar]
- 4.Yu T. Y., Jee J. H., Bae J. C., et al. Serum uric acid: a strong and independent predictor of metabolic syndrome after adjusting for body composition. Metabolism. 2016;65(4):432–440. doi: 10.1016/j.metabol.2015.11.003. [DOI] [PubMed] [Google Scholar]
- 5.Chen M. Y., Zhao C. C., Li T. T., et al. Serum uric acid levels are associated with obesity but not cardio-cerebrovascular events in Chinese inpatients with type 2 diabetes. Scientific Reports. 2017;7(1, article 40009) doi: 10.1038/srep40009. [DOI] [PMC free article] [PubMed] [Google Scholar]
- 6.Dai X., Yuan J., Yao P., et al. Association between serum uric acid and the metabolic syndrome among a middle- and old-age Chinese population. European Journal of Epidemiology. 2013;28(8):669–676. doi: 10.1007/s10654-013-9829-4. [DOI] [PubMed] [Google Scholar]
- 7.Lee Y.-J. G., Lee Y. J., Jeong D. U. Differential effects of obesity on obstructive sleep apnea syndrome according to age. Psychiatry Investigation. 2017;14(5):656–661. doi: 10.4306/pi.2017.14.5.656. [DOI] [PMC free article] [PubMed] [Google Scholar]
- 8.Vijayan V. K. Morbidities associated with obstructive sleep apnea. Expert Review of Respiratory Medicine. 2012;6(5):557–566. doi: 10.1586/ers.12.44. [DOI] [PubMed] [Google Scholar]
- 9.Lubrano C., Saponara M., Barbaro G., et al. Relationships between body fat distribution, epicardial fat and obstructive sleep apnea in obese patients with and without metabolic syndrome. PLoS One. 2012;7(10, article e47059) doi: 10.1371/journal.pone.0047059. [DOI] [PMC free article] [PubMed] [Google Scholar]
- 10.Kim A. M., Keenan B. T., Jackson N., et al. Tongue fat and its relationship to obstructive sleep apnea. Sleep. 2014;37(10):1639–1648. doi: 10.5665/sleep.4072. [DOI] [PMC free article] [PubMed] [Google Scholar]
- 11.Hirotsu C., Tufik S., Guindalini C., Mazzotti D. R., Bittencourt L. R., Andersen M. L. Association between uric acid levels and obstructive sleep apnea syndrome in a large epidemiological sample. PLoS One. 2013;8(6, article e66891) doi: 10.1371/journal.pone.0066891. [DOI] [PMC free article] [PubMed] [Google Scholar]
- 12.Bouloukaki I., Mermigkis C., Tzanakis N., et al. Evaluation of inflammatory markers in a large sample of obstructive sleep apnea patients without comorbidities. Mediators of Inflammation. 2017;2017:13. doi: 10.1155/2017/4573756.4573756 [DOI] [PMC free article] [PubMed] [Google Scholar]
- 13.Kanbay A., Inonu H., Solak Y., et al. Uric acid as a potential mediator of cardiovascular morbidity in obstructive sleep apnea syndrome. European Journal of Internal Medicine. 2014;25(5):471–476. doi: 10.1016/j.ejim.2014.04.005. [DOI] [PubMed] [Google Scholar]
- 14.Kosacka M., Brzecka A., Piesiak P., Korzeniewska A., Jankowska R. Soluble ligand CD40 and uric acid as markers of atheromatosis in patients with obstructive sleep apnea. In: Pokorski M., editor. Inflammatory Disorders. Vol. 839. Cham: Springer; 2014. pp. 55–60. (Advances in Experimental Medicine and Biology). [DOI] [PubMed] [Google Scholar]
- 15.Liu C. Q., He C. M., Chen N., et al. Serum uric acid is independently and linearly associated with risk of nonalcoholic fatty liver disease in obese Chinese adults. Scientific Reports. 2016;6(1, article 38605) doi: 10.1038/srep38605. [DOI] [PMC free article] [PubMed] [Google Scholar]
- 16.Berry R. B., Brooks R., Gamaldo C. E., et al. The AASM Manual for the Scoring of Sleep and Associated Events: Rules, Terminology and Technical Specifications, Version 2. Darien, Illinois: American Academy of Sleep Medicine; 2012. [Google Scholar]
- 17.Chen G.-P., Qi J. C., Wang B. Y., et al. Applicability of visceral adiposity index in predicting metabolic syndrome in adults with obstructive sleep apnea: a cross-sectional study. BMC Pulmonary Medicine. 2016;16(1):p. 37. doi: 10.1186/s12890-016-0198-0. [DOI] [PMC free article] [PubMed] [Google Scholar]
- 18.Liu Z., Chen T., Niu H., et al. The establishment and characteristics of rat model of atherosclerosis induced by hyperuricemia. Stem Cells International. 2016;2016:7. doi: 10.1155/2016/1365257.1365257 [DOI] [PMC free article] [PubMed] [Google Scholar]
- 19.Wysocka E., Cofta S., Piorunek T., Dziegielewska-Gesiak S., Bryl W., Torlinski L. Blood antioxidant status, dysglycemia and obstructive sleep apnea. In: Pokorski M., editor. Respiratory Regulation - The Molecular Approach. Vol. 756. Dordrecht: Springer; 2013. pp. 121–129. (Advances in Experimental Medicine and Biology). [DOI] [PubMed] [Google Scholar]
- 20.Ng M., Fleming T., Robinson M., et al. Global, regional, and national prevalence of overweight and obesity in children and adults during 1980–2013: a systematic analysis for the Global Burden of Disease Study 2013. The Lancet. 2014;384(9945):766–781. doi: 10.1016/S0140-6736(14)60460-8. [DOI] [PMC free article] [PubMed] [Google Scholar]
- 21.Grassi D., Ferri L., Desideri G., et al. Chronic hyperuricemia, uric acid deposit and cardiovascular risk. Current Pharmaceutical Design. 2013;19(13):2432–2438. doi: 10.2174/1381612811319130011. [DOI] [PMC free article] [PubMed] [Google Scholar]
- 22.Cibičková Ľ., Langová K., Vaverková H., Kubíčková V., Karásek D. Correlation of uric acid levels and parameters of metabolic syndrome. Physiological Research. 2017;66(3):481–487. doi: 10.33549/physiolres.933410. [DOI] [PubMed] [Google Scholar]
- 23.Park B., Lee H. A., Lee S. H., et al. Association between serum levels of uric acid and blood pressure tracking in childhood. American Journal of Hypertension. 2017;30(7):713–718. doi: 10.1093/ajh/hpx037. [DOI] [PubMed] [Google Scholar]
- 24.Li L. X., Dong X. H., Li M. F., et al. Serum uric acid levels are associated with hypertension and metabolic syndrome but not atherosclerosis in Chinese inpatients with type 2 diabetes. Journal of Hypertension. 2015;33(3):482–490. doi: 10.1097/HJH.0000000000000417. [DOI] [PMC free article] [PubMed] [Google Scholar]
- 25.Ye J. Mechanisms of insulin resistance in obesity. Frontiers of Medicine. 2013;7(1):14–24. doi: 10.1007/s11684-013-0262-6. [DOI] [PMC free article] [PubMed] [Google Scholar]
- 26.Ye J., Gimble J. M. Regulation of stem cell differentiation in adipose tissue by chronic inflammation. Clinical and Experimental Pharmacology & Physiology. 2011;38(12):872–878. doi: 10.1111/j.1440-1681.2011.05596.x. [DOI] [PMC free article] [PubMed] [Google Scholar]
- 27.Modena D. A. O., Cazzo E., Cândido E. C., et al. Obstructive sleep apnea syndrome among obese individuals: a cross-sectional study. Revista Da Associacao Medica Brasileira. 2017;63(10):862–868. doi: 10.1590/1806-9282.63.10.862. [DOI] [PubMed] [Google Scholar]
- 28.Trzepizur W., Gagnadoux F. Épidémiologie du syndrome d’apnées-hypopnées obstructives du sommeil. Revue des Maladies Respiratoires. 2014;31(6):568–577. doi: 10.1016/j.rmr.2014.01.013. [DOI] [PubMed] [Google Scholar]
- 29.Schwartz A. R., Patil S. P., Laffan A. M., Polotsky V., Schneider H., Smith P. L. Obesity and obstructive sleep apnea: pathogenic mechanisms and therapeutic approaches. Proceedings of the American Thoracic Society. 2008;5(2):185–192. doi: 10.1513/pats.200708-137MG. [DOI] [PMC free article] [PubMed] [Google Scholar]
- 30.Araújo L. d. S., Fernandes J. F. R., Klein M. R. S. T., Sanjuliani A. F. Obstructive sleep apnea is independently associated with inflammation and insulin resistance, but not with blood pressure, plasma catecholamines, and endothelial function in obese subjects. Nutrition. 2015;31(11-12):1351–1357. doi: 10.1016/j.nut.2015.05.017. [DOI] [PubMed] [Google Scholar]
Associated Data
This section collects any data citations, data availability statements, or supplementary materials included in this article.
Data Availability Statement
The data used to support the findings of this study are available from the corresponding author upon reasonable request.