
Figure 3.
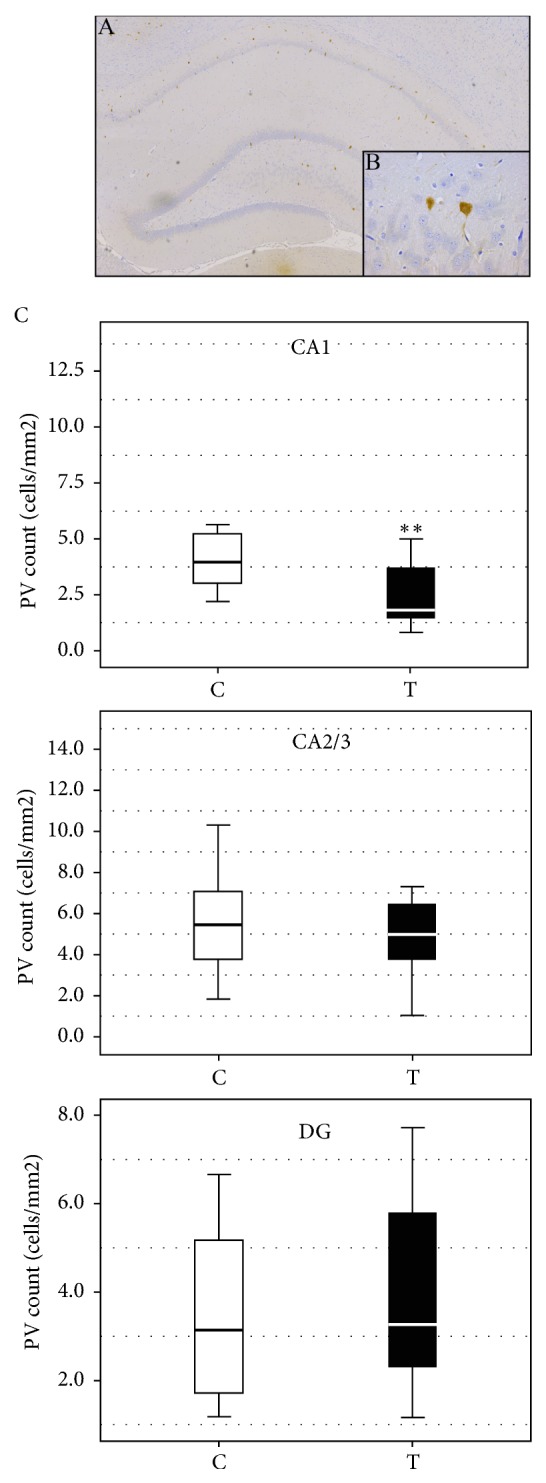
(A, B) Representative caption of immunohistochemical expression of PV+ interneurons in rat hippocampus from the control group. (A) Hippocampus of control group, magnification 50x; (B) PV immunoreactive cells in control group, high magnification 400x. (C) The effect of prenatal testosterone undecanoate treatment on the number of PV immunoreactive neurons in the hippocampal regions. Boxplots represent medians ± quartile range, n=6. The significance of the difference was estimated using Mann-Whitney U test (∗∗p < 0.01). For details see caption of Figure 1.