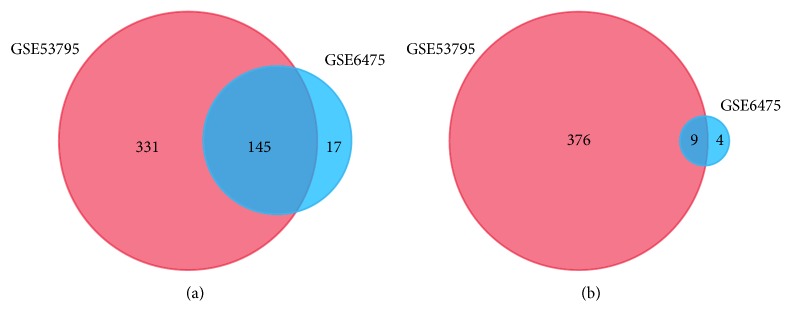
Figure 1.
Identification of DEGs from two datasets GSE6475 and GSE53795 using the online tool GEO2R (https://www.ncbi.nlm.nih.gov/geo/geo2r/). The threshold for filtering DEGs is P<0.05 and [logFC] ≥ 1. Different colors indicate different datasets. The cross part represents the common DEGs. (a) Common upregulated DEGs of the two datasets. (b) Common downregulated DEGs of the two datasets.

