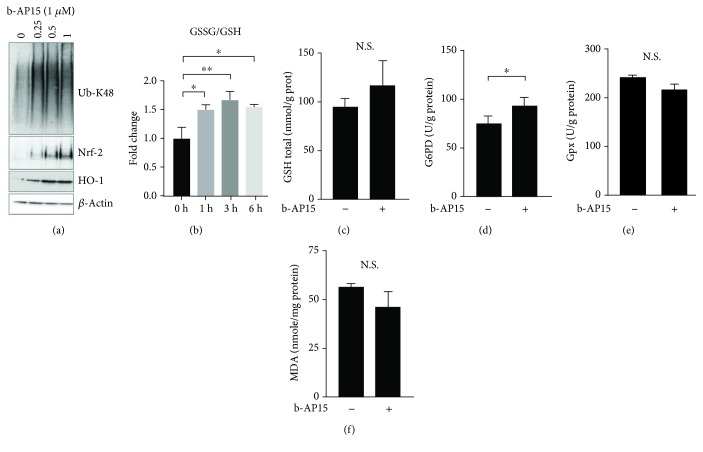
Figure 2.
Evidence of oxidative stress in b-AP15-exposed HCT116 cells. (a) HCT116 cells were exposed to 0.5% DMSO or b-AP15 (0.25, 0.5, and 1.0 μM in 0.5% DMSO) for 6 h, and extracts were prepared and subjected to immunoblotting using the indicated antibodies. (b) Increases in the ratio of GSSG/GSH in HCT116 cells exposed to 1 μM b-AP15 for the indicated times (mean ± S.D.; ∗p < 0.05, ∗∗p < 0.01; n = 3). (c) Total levels of GSH were determined in vehicle-treated cells and in cells exposed to 1 μM b-AP15 for 6 h (mean ± S.D.; n = 3; N.S.: not significant at p < 0.05). (d) Glucose-6-phosphate dehydrogenase activity in HCT116 cells exposed to 1 μM b-AP15 for 6 h compared to vehicle-treated cells (mean ± S.D.; ∗p < 0.05; n = 3). (e) Glutathione peroxidase activity in HCT116 cells exposed to 1 μM b-AP15 for 6 h compared to vehicle-treated cells (mean ± S.D.; n = 3). (f) Malondialdehyde levels in HCT116 cells exposed to 1 μM b-AP15 or vehicle for 6 h. Statistical significance was calculated using Student's t-test in (b)–(f).

