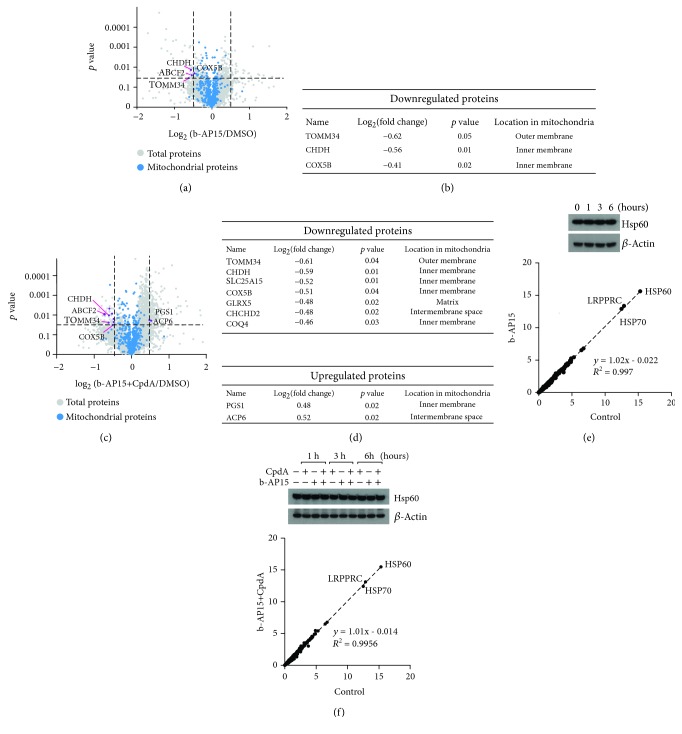
Figure 5.
Proteomic analysis of mitochondrial proteins. (a) Volcano plot showing log2(fold change) versus p values for proteins from isolated mitochondria prepared from HCT116 cells treated with DMSO or 1 μM b-AP15 for 6 h. (b) Top candidates with significant changes from (a) (p ≤ 0.05, log2 ≥ 0.4 or log2 < −0.4). (c) Volcano plot showing log2(fold change) versus p values for proteins from isolated mitochondria prepared from HCT116 cells treated with DMSO or 1 μM b-AP15 and 10 μM CpdA for 6 h. (d) Top candidates with significant changes from (c) (p ≤ 0.05, log2 ≥ 0.4 or log2 < −0.4). (e, f) Upper part: HCT116 cells were exposed to 0.5% DMSO, 1 μM b-AP15 in the presence or absence of 10 μM CpdA for 1, 3, and 6 h, as indicated. Extracts were prepared and subjected to immunoblotting using antibodies to Hsp60 and β-actin. (e, f) Lower part: mitochondria were purified from cells treated with 1 μM b-AP15 in the presence or absence of 10 μM CpdA and analyzed by shotgun proteomics. Data was normalized to control samples (treated with 0.5% DMSO).

