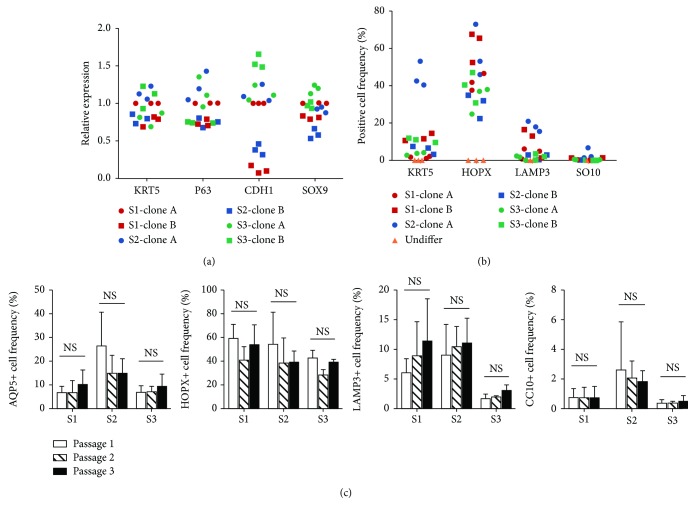
Figure 3.
Diversity analysis of DASC differentiation potency at single cell resolution. (a) qPCR analysis of stem cell markers KRT5, P63, CDH1, and SOX9 expressed in 6 different single-cell-derived DASC clones originated from 3 individuals. 2 clones (clone A and clone B) were generated from each individual. (b) Diagram showing the ratio of AQP5+, HOPX+, LAM3+, and CC10+ cells generated from different single-cell-derived clones after 12 days of monolayer differentiation. DASCs before monolayer differentiation (Undiffer) were used as a negative control. (c) AQP5+, HOPX+, LAM3+, and CC10+ cell frequencies in differentiated DASCs at different culture passages. S1: healthy subject; S2: subject with ILD; S3: subject with bronchiectasis.

