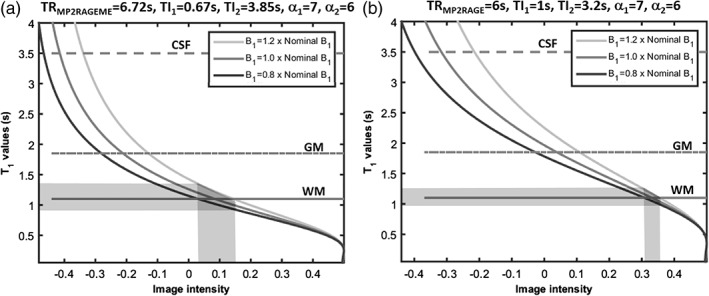
Figure 2.

Sensitivity to B1 +‐inhomogeneity. The signal intensity curves of MP2RAGE depend on the local B1 +. The simulated image intensities for the MP2RAGEME (left) and MP2RAGE (right) protocols used are compared here for different B1 + values. The spread of image intensity values (x axis) for the white matter (shaded area, continuous line) is larger in the MP2RAGEME protocol for a B1‐range of 0.8–1.2 times nominal B1. For GM (broken line) the image intensity ranges are comparable for the two protocols. For the cerebrospinal fluid (CSF, dotted line), the simulated range of intensities is wider for the MP2RAGE protocol. Note the slightly different ranges of image intensities along the x axis
