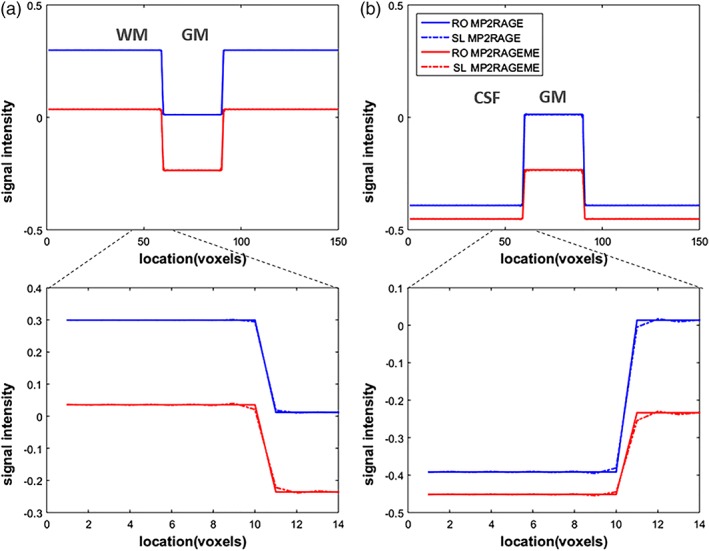
Figure 3.

T1‐induced blurring. The signal development during the acquisition leads to a blurring in the final image. As most of the T1‐evolution happens during the first inversion, this is the main culprit. And as the TI1 of the MP2RAGEME is shorter, there is more T1‐evolution during the (equally long) readout. This leads to slightly increased blurring in the slice direction (SL, dashed lines), which is compared to the unaffected readout (RO) direction. Note that signal levels differ between the MP2RAGE and MP2RAGEME acquisitions and hence their signal profiles do not overlap. (a) Simulated image containing a square of 30 × 30 GM voxels in a WM background. (b) Simulated image containing a square of 30 × 30 GM voxels in a cerebrospinal fluid (CSF) background. The larger T1‐difference between gray matter and CSF means this border is more affected than the WM/GM one [Color figure can be viewed at http://wileyonlinelibrary.com]
