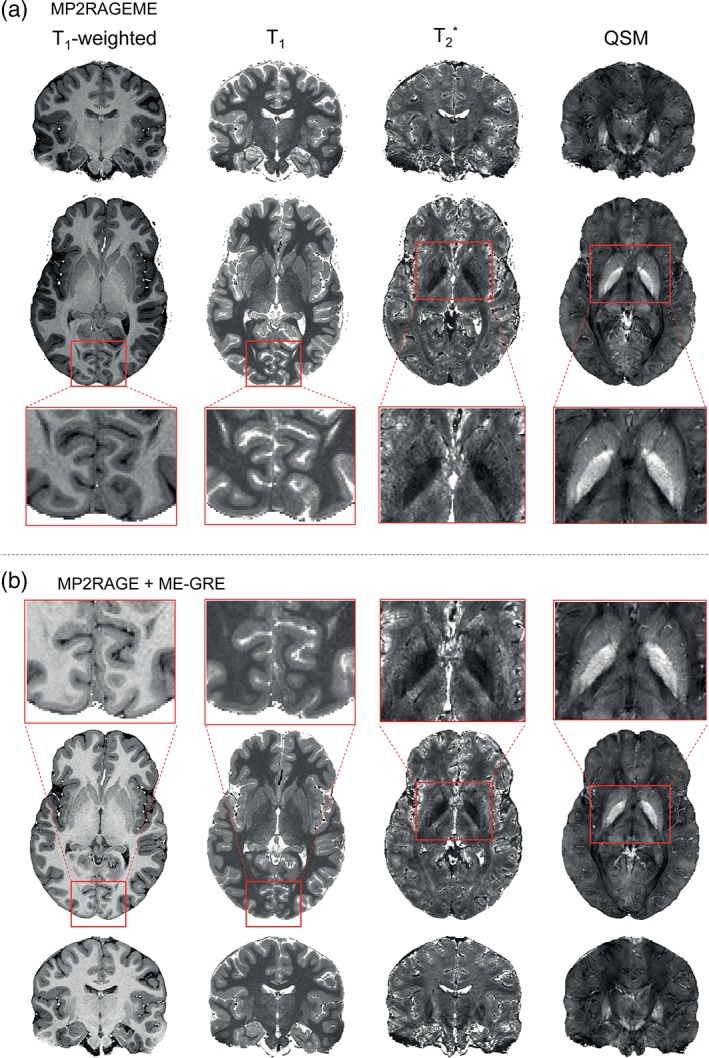
Figure 4.

Example derived images. (a) Images generated from the MP2RAGEME acquisition are shown for a single subject (as in Figure 1) in axial and coronal views. T1‐weighted images are presented, as are T1‐maps, T2 *‐maps, and susceptibility maps. (b) MP2RAGE and ME‐GRE images are shown in coronal view. Note the different T1‐weightings but comparable T1‐maps [Color figure can be viewed at http://wileyonlinelibrary.com]
