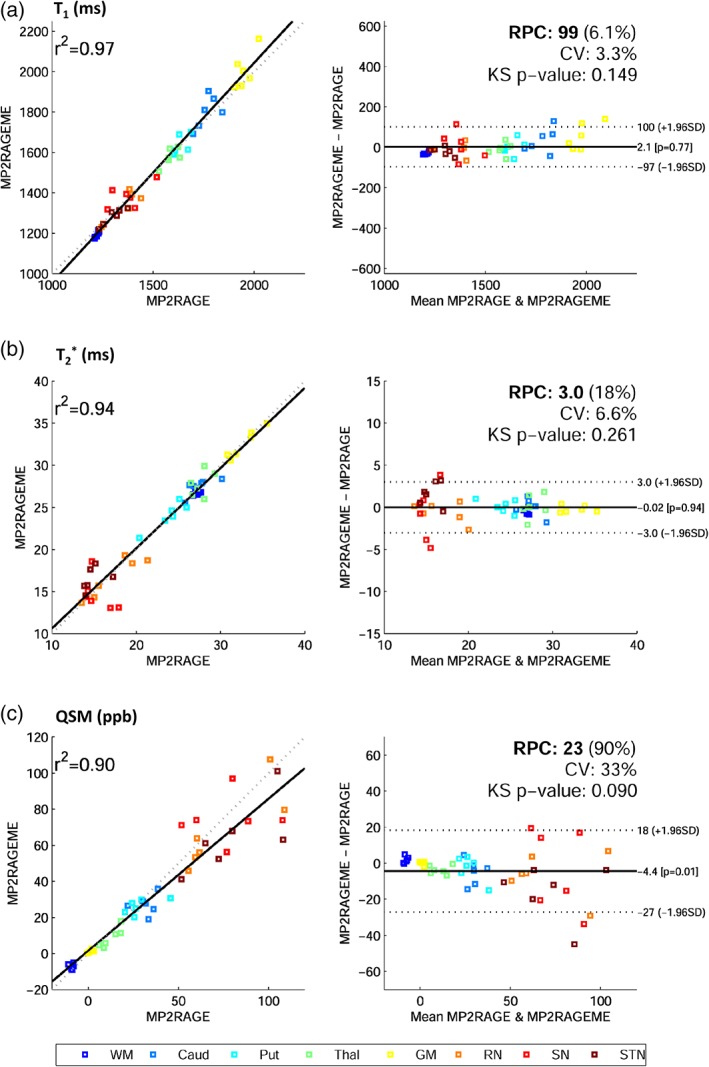
Figure 6.

Bland–Altman plots. Correlation and difference plots for (a) T1, (b) T2*, and (c) QSM, for white matter (WM), caudate (Caud), putamen (put), thalamus (Thal), gray matter (GM), red nucleus (RN), substantia nigra (SN), and subthalamic nucleus (STN). The statistics Pearson's correlation coefficient (r 2), reproducibility coefficient (RPC), coefficient of variation (CV), and a Kolmogorov–Smirnov (KS) test of non‐Gaussianity of differences are also given. Mean regions of interest values for all six subjects are plotted. Fitted (solid) and identity (dashed) lines are given in the correlation plots (left), and mean difference (solid) and 95% confidence interval (dashed) lines (right) are depicted [Color figure can be viewed at http://wileyonlinelibrary.com]
