
Figure 7.
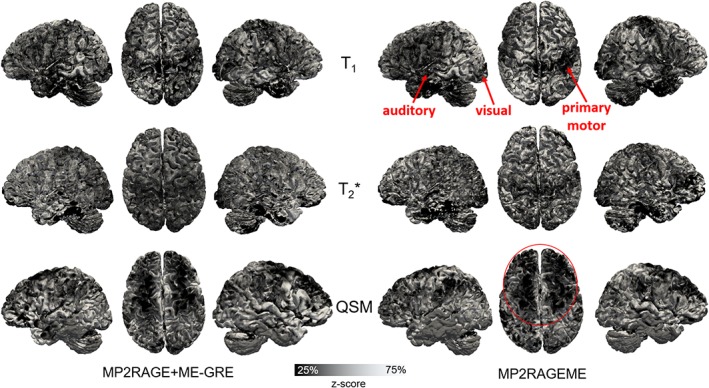
Comparison of the cortical contrasts. Maps of mid‐cortical T1, T2 *, and QSM variations obtained for a single subject (as in Figure 1) with the separate MP2RAGE and GREME or the combined MP2RAGEME approach. Cortical depth was estimated with volumetric layering and values were smoothed along the mid‐cortical depth with a 0.64 mm FWHM Gaussian kernel. Surface reconstructions were obtained from the underlying T1 maps. To compare local patterns all maps were z‐scored parallel to the cortex based on median and interquartile range. Locations of primary motor, auditory and visual cortices are indicated in T1 maps, as well as lower QSM values in the anterior part of the cortex [Color figure can be viewed at http://wileyonlinelibrary.com]