
Figure 8.
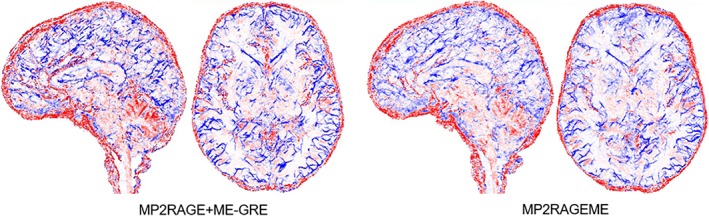
Arterial and venous vasculature. Vasculature reconstructed from the separate MP2RAGE and GREME or the MP2RAGEME‐sequence data (maximum intensity projections over 20 slices in axial and sagittal directions, colored in red for structures extracted from T1 maps (arteries) and blue for structures extracted from 1/T2 * maps (veins). Note the tight interaction of arteries and veins locations, making precise coregistration of the contrast particularly important. Images are for the same single subject as in Figure 1 [Color figure can be viewed at http://wileyonlinelibrary.com]