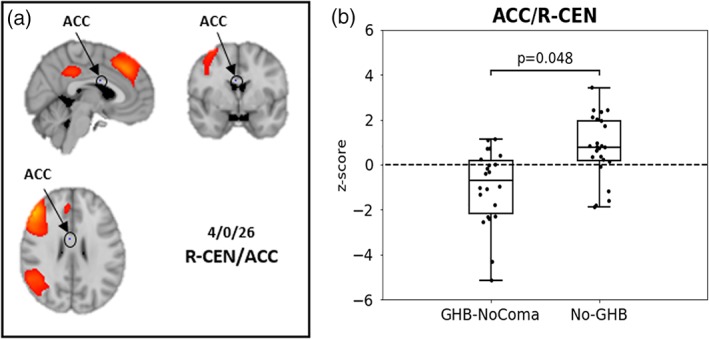
Figure 2.

Resting‐state functional‐connectivity (rsFC) within the R‐CEN in the dorsal ACC. (a) R‐CEN group network as estimated with meta‐ICA in hot colors and a voxel of significant group differences between the GHB‐NoComa group and the No‐GHB group located in the ACC [4,0,26] (in blue, highlighted through a circle). (b) Boxplot showing the z‐scored rsFC for the two groups as estimated through dual regression in the significant voxel highlighted in (a). The GHB‐NoComa group showed lower rsFC within the R‐CEN compared to the No‐GHB group (box plot showing median value within the peak voxel; 1.5* interquartile range; dots represent connectivity values of individual participants (4,0,26); FWE‐corrected across networks; p = 0.048) [Color figure can be viewed at http://wileyonlinelibrary.com]
