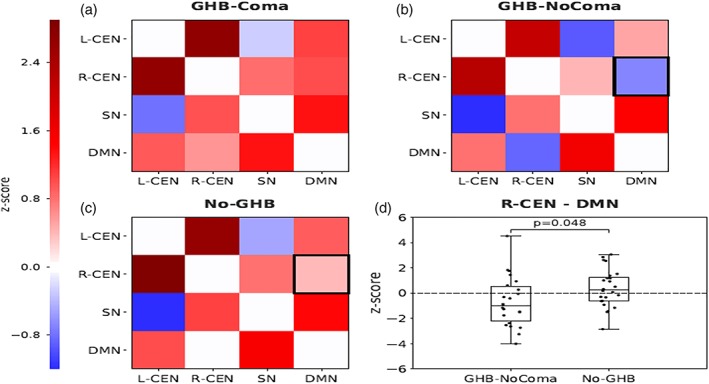
Figure 3.

Resting‐state functional‐connectivity (rsFC) between the four resting‐state networks of interest: DMN, right CEN (R‐CEN), left CEN (L‐CEN), and SN for the contrast GHB‐NoComa < No‐GHB. (a–c) rsFC between the R‐CEN, L‐CEN, SN, and DMN in the GHB‐coma, GHB‐NoComa, and No‐GHB group. The upper triangular part of the matrix shows Pearson correlations while the lower triangular shows partial correlations. The black box indicates a significant difference. (d) Significant decrease in rsFC between the R‐CEN and the DMN in the GHB‐NoComa when compared to the No‐GHB group. Boxplots show median and whiskers are calculated as 1.5* interquartile range. Dots represent connectivity values of individual participants. (FWE‐corrected; p = 0.048) [Color figure can be viewed at http://wileyonlinelibrary.com]
