
Figure 4.
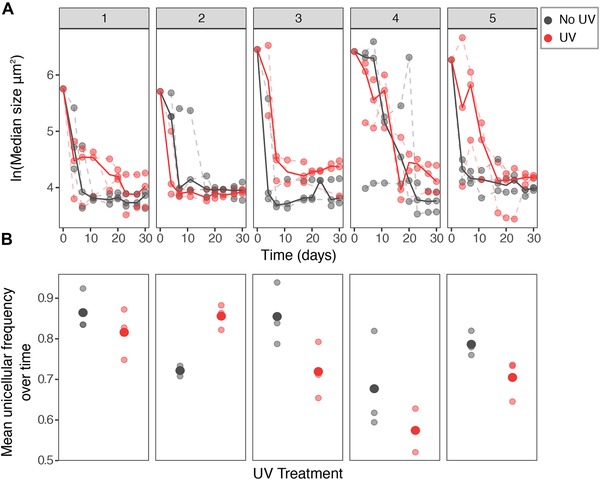
Dynamics of reversal to unicellularity. Different panels show different ancestral populations. (A) Graphs of median size over time. Solid circles indicate different replicate lines (n = 3) and solid lines the mean trajectory. Although all populations converge to unicellular phenotypes the mode and tempo of evolution differs between populations and even within replicate lines of the same population. (B) Except in population two, populations in the UV treatment have in average a lower frequency of unicellular individuals over the course of the experiment. There is substantial variation between and within ancestral backgrounds (populations).