
Fig. 5.
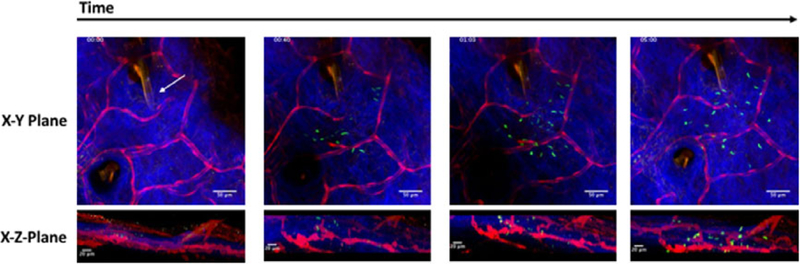
Sporozoite inoculation into dermis. Two-photon time series of injection into skin. The time series begins with pipette (coated in 1:50 orange enamel, indicated with white arrow) in the dermis before injection. Observation of sporozoite inoculation into dermis with just a few sporozoites trickling into the tissue at40s followed by bulk injection of sporozoites. XY maximum projection shown in top panel with corresponding XZ maximum projection shown beneath. Red channel = vasculature and pipette; blue channel = collagen; green channel = parasites and pipette. Timestamp in upper left corner. Scale bar in top panels = 50 μm; scale bar in bottom panels = 20 μm.