
Figure 3.
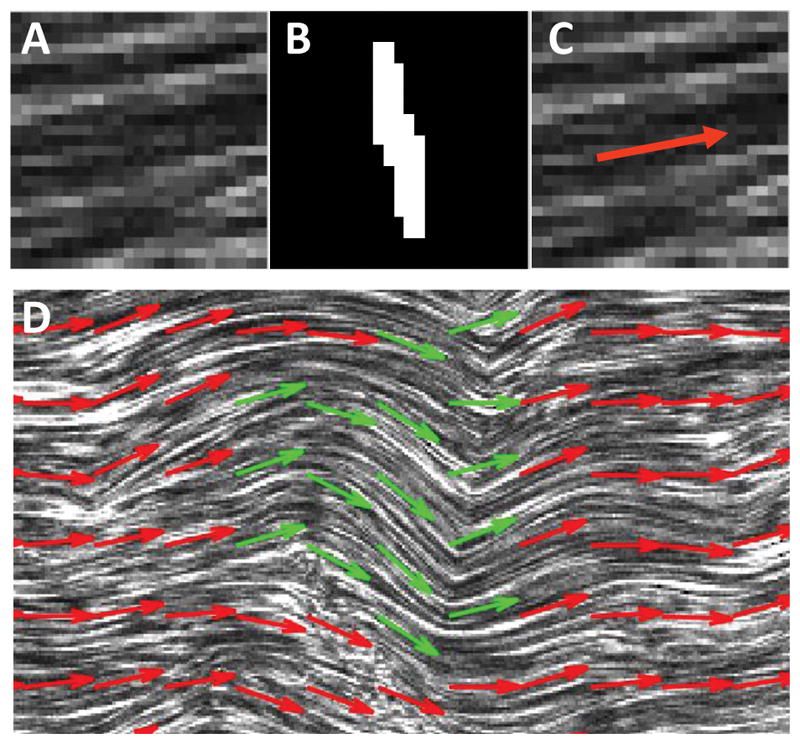
Measurement of local collagen fiber orientation. (A) Representative subregion of SHG image (18×18 μm). (B) Binarized image of two-dimensional Fourier transform for the subregion. (C) Average collagen fiber orientation shown based on direction perpendicular to image of Fourier transform. (D) Representative image of fiber kinking (green arrows), which was defined as a >30 ° change in fiber orientation between adjacent subregions.