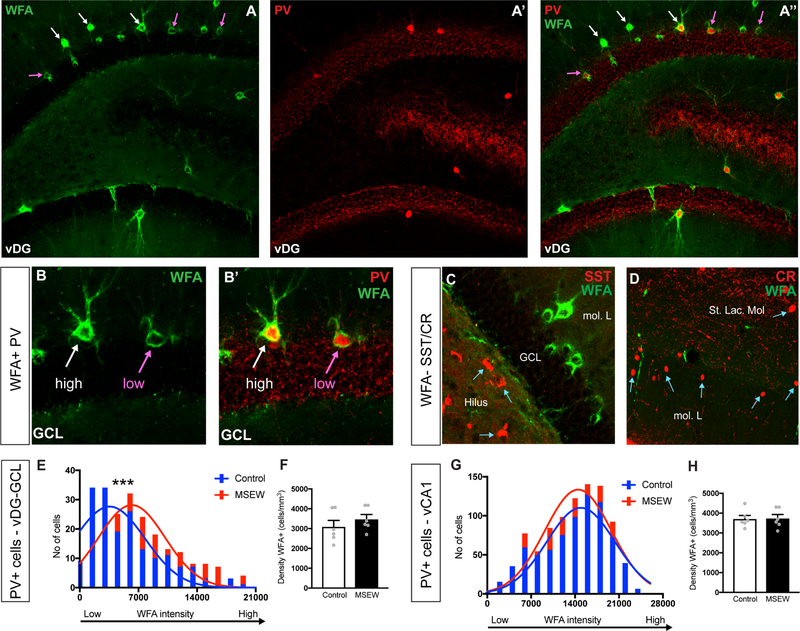
Figure 5.
(A-A’’) Images of PV+ cells and WFA+ perineuronal nets (PNNs) in the vDG of MSEW mice. (B-B’) Higher magnification images depicting high and low intensity WFA stained PNNs surrounding PV+ cells. (C-D) SST and CR interneurons are not encapsulated by WFA+ PNNs. (E) MSEW mice showed a significant increase in intensities of WFA labelled PNNs in the vDG-GCL. (F) Graph showing no differences in the density of WFA+ PNNs in the vDG-GCL. (G) Graph showing no differences between groups in the intensities of WFA labelled PNNs in the vCA1. (H) Graph showing no differences in the density of WFA+ PNNs in the vCA1. *p<0.05, ***p<0.001

