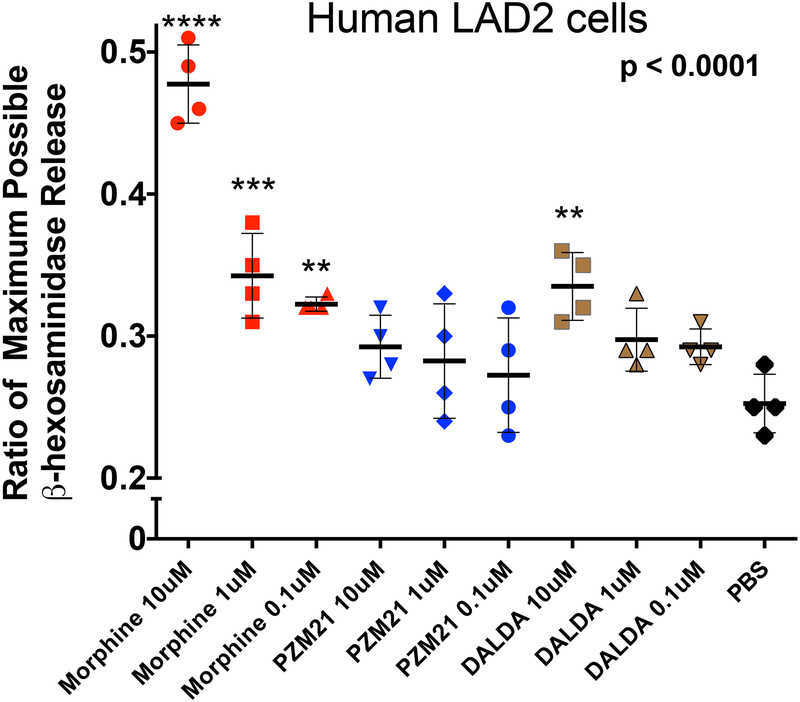
Figure 5:
Graph presents the scatter plot of mast cell degranulation as measured by the concentrations of ß hexosaminidases in the supernatent of human LAD2 cells incubated with increasing concentrations (0.1 to 10 μM) of morphine, PZM-21 and DMT-DALDA. Y axis plots the release of β-hexosaminidase presented as the ratio of the maximum possible release produced by compound 48–80. Each point represents a single well. Data were analyzed with a one-way ANOVA followed by a post hoc comparison to PBS: **p<0.01; ***p<0.001; ****p<0.0001.

