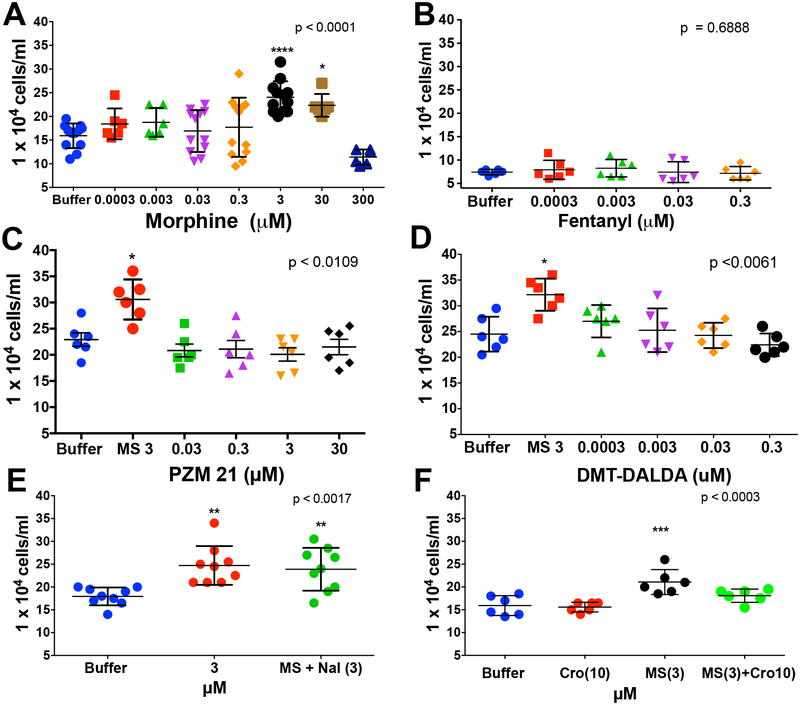
Figure 6:
Scattergrams display the proliferative response of mouse embryonic fibroblasts (MEFs) after 48 hrs in the presence of: A) vehicle or 0.3 nM - 300 μM morphine, with the maximum proliferative response produced by 3 μM; B) vehicle or morphine (MS: 3 μM) or morphine (3 μM) + naloxone (Nal: 3 μM) showing that the proliferative effects of morphine were not altered by equimolar concentrations of the opioid antagonist; C) vehicle or morphine (3 μM) or PZM21 (0.03 – 30 μM) showing no effect of PZM21; D) vehicle or morphine (3 μM) or DMT-DALDA (0.03 – 30 μM) showing no effect of DMT-DALDA; and E) 0.3 pM - 300 nM Fentanyl for 48 hrs. F) Vehicle or morphine (MS: 3 μM) or 48–80 (1 μg/mL) or morphine (3 μM)/or 48–80 (1μg/mL) + cromolyn (Cro: 10 μM) showing that the proliferative effects of morphine were mimicked by 48–80 and prevented by the mast cell stabilizer. Each point represents a single well. For each drug, a one-way ANOVA was performed and a post hoc analysis was performed comparing vehicle: p<0.05; **p<0.01; ***p<0.001.

