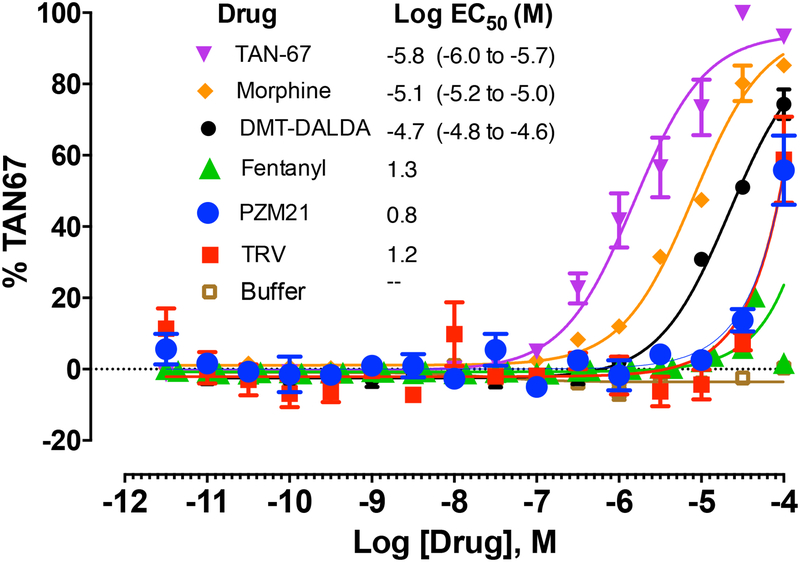
Figure 8:
Graph presents the concentration response curves for the PRESTO-TANGO assay showing MRG activation by TAN 67, morphine, (DMT)1-DALDA, PZM21, TRV 130, Fentanyl and Buffer. Y-axis expresses the activation in terms of the % of the response observed with TAN67. Best fit log regression curves are presented. The inserted table presents the calculated Log EC50, with 95% confidence intervals for each of the test compounds.

