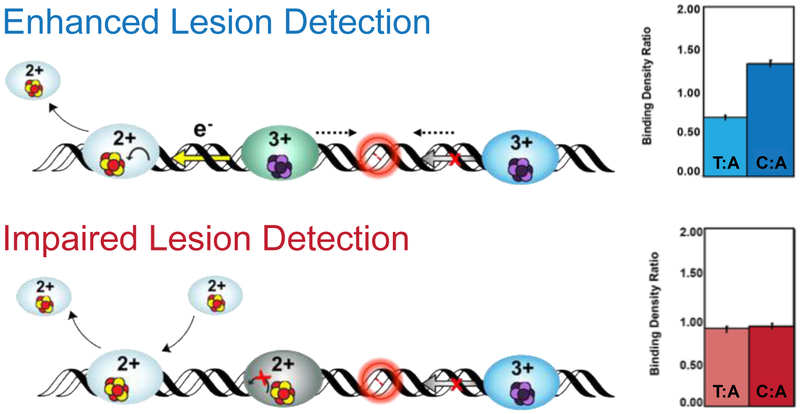
Figure 8. Visualization of Protein Localization on Damaged DNA by Atomic Force Microscopy (AFM).
In the AFM redistribution assay, [4Fe4S] protein or protein mixtures are incubated with DNA substrates which contain either long, well matched DNA strands (3.8 kb) or strands containing a single C:A mismatch in the 3.8 kb duplex along with short, undamaged DNA strands (1.6 and 2.2 kb). Images are collected and proteins bound to long strands of DNA are counted, normalized to the proteins bound to the short strands, and expressed as a binding density ratio (right). As shown at right (top), a greater density of proteins is found on the strands containing a mismatch (C:A) compared to the well-matched (T:A) strand, even though the repair proteins do not bind the C:A mismatch as a substrate. If the protein is defective in carrying out DNA CT, however, the binding density is the same on the mismatched and matched strands (bottom right) (55, 59, 79, 80).

