
Fig. 5.
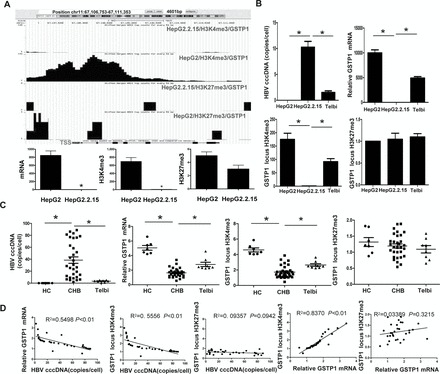
Expression and histone modifications of the GSTP1 gene. (A) GSTP1 gene locus and corresponding methylation states are illustrated at the top of each panel. Quantitation of H3K4me3, H3K27me3 and gene mRNA is presented at the bottom of each panel. *P < 0.01. (B and C) Comparison of HBV cccDNA, GSTP1 mRNA and H3K4me3 or H3K27me3 amounts in the GSTP1 gene locus between HepG2.2.15 and HepG2 or Telbivudine-treated HepG2.2.15 cells and between CHB liver and healthy liver or CHB liver with Telbivudine treatment. (D) Correlation between HBV cccDNA and GSTP1 mRNA expression, H3K4me3 amount or H3K27me3 amount in the GSTP1 locus. HC, healthy controls; Telbi, Telbivudine treatment; TSS, transcription starting site. *P < 0.01.