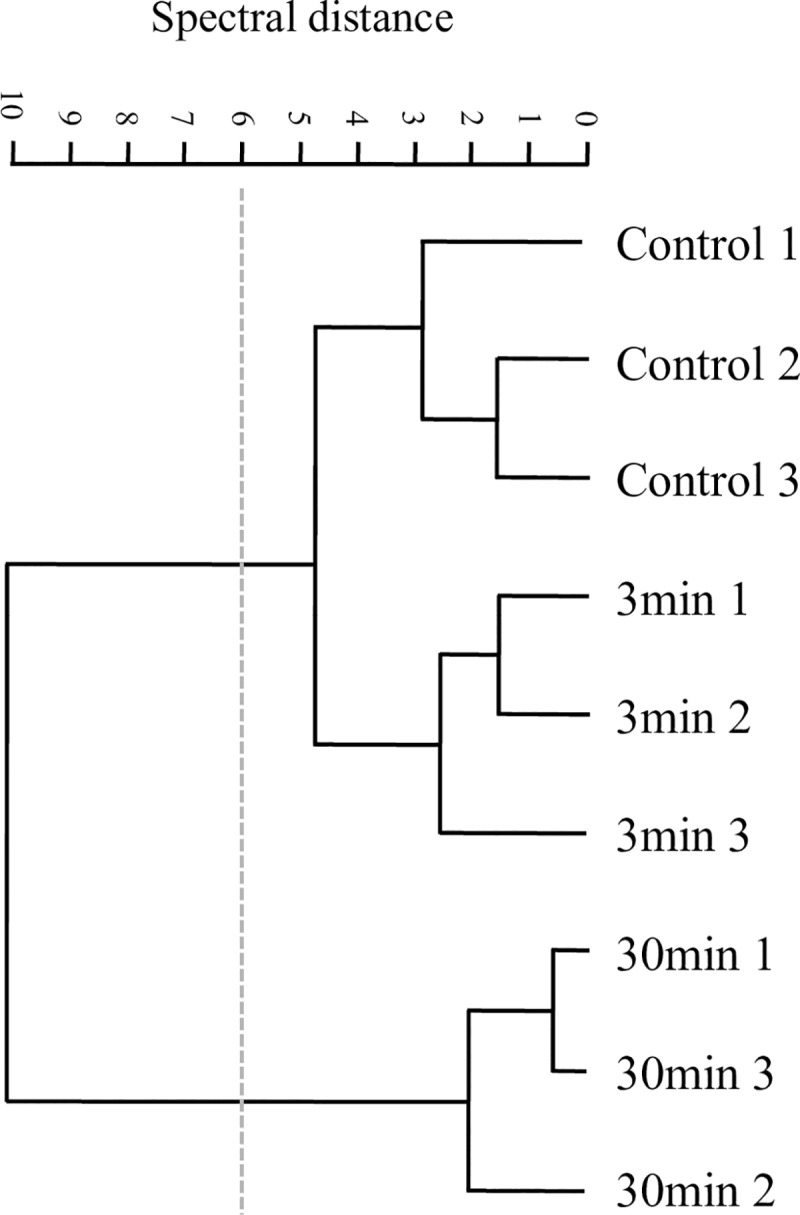
Fig 7. Plasma effect on whole P. aeruginosa biofilms.

Cluster analysis obtained with 2nd derivatives as input data using scaling to first range for spectral distance calculation in the entire IR spectrum: (3,000–2,800 cm-1), (1,800–1,550 cm-1), (1,500–1,250 cm-1), (1,200–900 cm-1). Dendrogram was constructed using Ward´s algorithm. The cut-off value of D = 6 is indicated with the dotted line.
