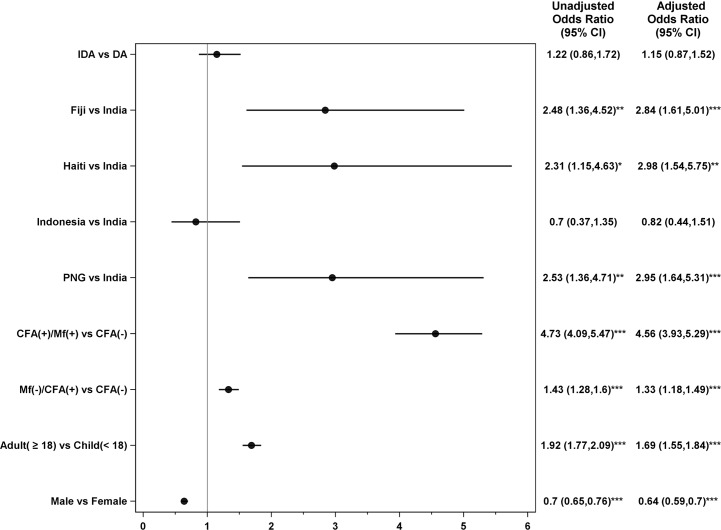
Fig 3. Forest plot showing adjusted odds ratios for factors associated with AEs following treatment for lymphatic filariasis.
Odds ratios were assessed relative to the listed reference groups. P values for comparisons to reference group: *<0.05, **<0.01, ***<0.001. Note that both unadjusted and adjusted models contain a random effect to account for correlation among subjects within a locality. Only the adjusted odds ratios and 95% CIs are plotted. All univariable models had a total N of 26,186 (3,147 with AEs) except for the infection group model, which had an N of 25,978 (3,122 with AEs) because of missing values for CFA or Mf. The multivariable model excluded all subjects with missing values for a total N of 25,978. Indonesian participants with Mf were considered to be CFA(+) for this analysis, although sometimes this was not the case. That is because Brugia infections are not detected by the CFA test. (-), negative results; (+), positive results; AE, adverse event; CFA, circulating filarial antigenemia; CI; confidence interval; DA, double-drug therapy (albendazole, diethylcarbamazine); IDA, triple-drug therapy (albendazole, diethylcarbamazine, ivermectin); MF, microfilaremia; PNG, Papua New Guinea.

