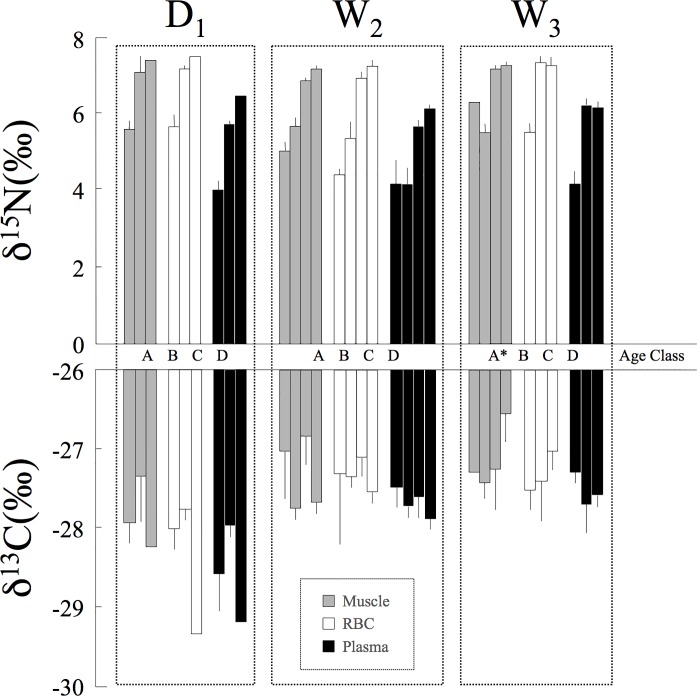
Fig 3. Mean (+SE) δ15N and δ13C values for black caimans in different age classes.
Values are represented for the three sampling periods (D1, W2, W3) and the three tissues sampled (gray = muscle, white = RBCs, and black = plasma). The age classes are represented in the same order for each sampling period (A, B, C, D, with the number of caimans sampled). *During W3, only muscle was sampled for the sole individual captured in age class A.

