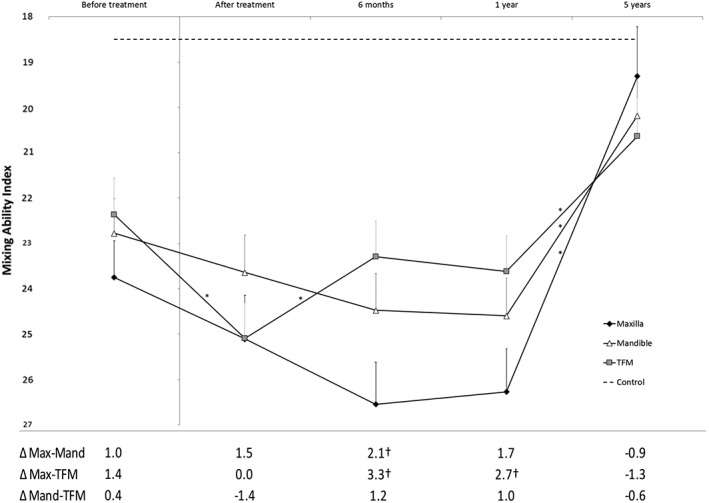
Figure 3.

Estimates of mixing ability index (MAI) and SE rendered using a mixed‐model analysis. The y‐axis inverted for more values entered into the model was that of the mean patient in the cohort, calculated using a least‐squares method. The outcome presented is divided by the location of the primary tumor over a 5‐year follow up. Differences between groups are presented in the table under the figure. MAI ranges from 0 to 30, where 0 represents the best and 30 the worst possible outcome; thus for convenience, the y‐axis has been inverted. *A significant difference (P < .05) between that and the next assessment; † A significant difference (P < .05) between 2 groups at the same assessment time point, calculated using a restricted maximum likelihood approach. Only the assessment at 5 years after treatment of the maxillary tumor group was not significantly different from the control group (P = .27). Max, Maxilla; Mand, Mandible; TFM, Tongue/Floor of the Mouth
