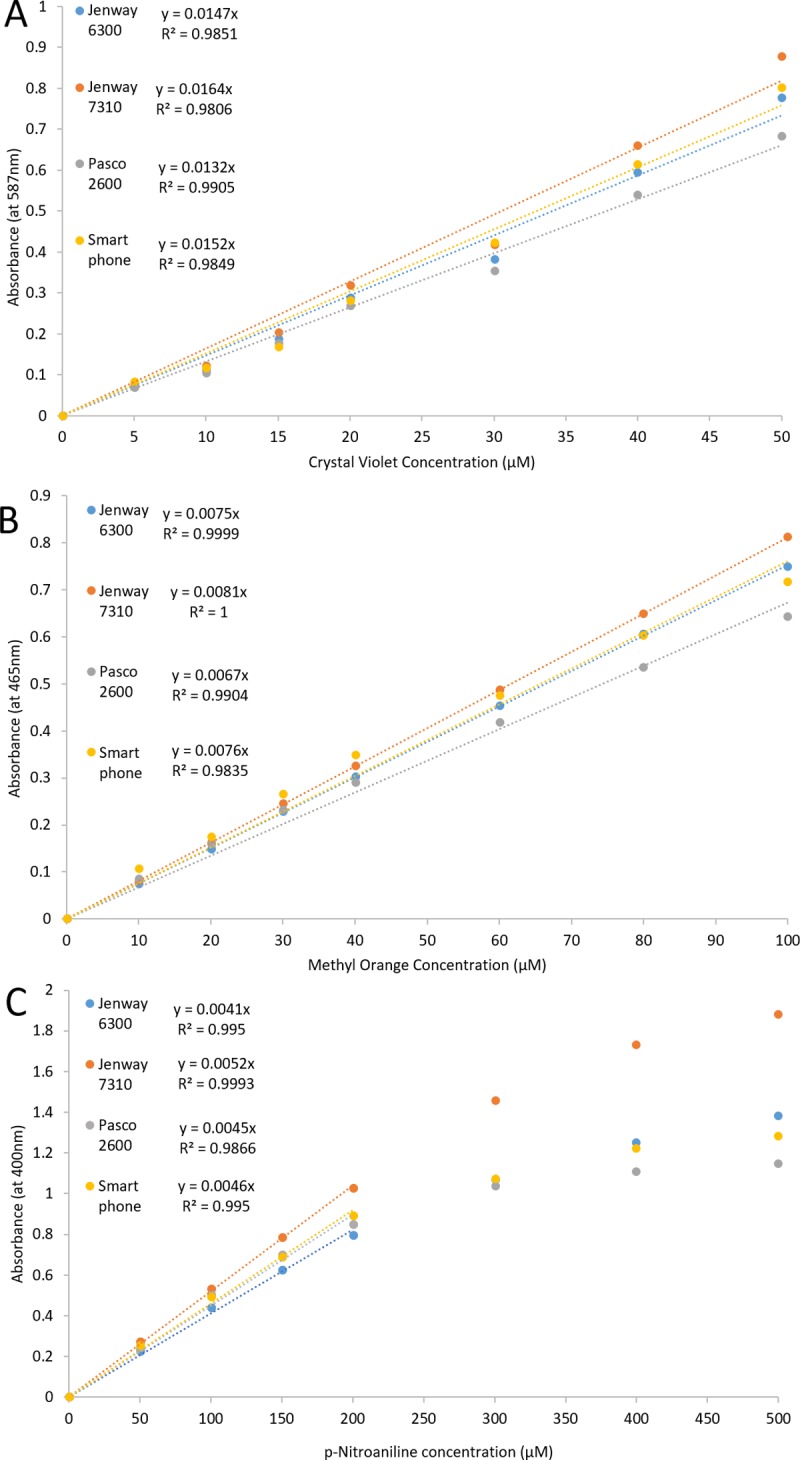
Fig 2.

Calibration graphs for crystal violet (A), methyl orange (B), and p-nitroaniline (C) from 3 commercial spectrophotometers and the smartphone spectrophotometer. Points are from a single observation of the same solution for all spectrophotometers. Concentrations of p-nitroaniline demonstrating negative deviation (at concentrations > 200 μM) have been eliminated from the trend lines equations for all spectrophotometers. Data are available in S1 Data.
