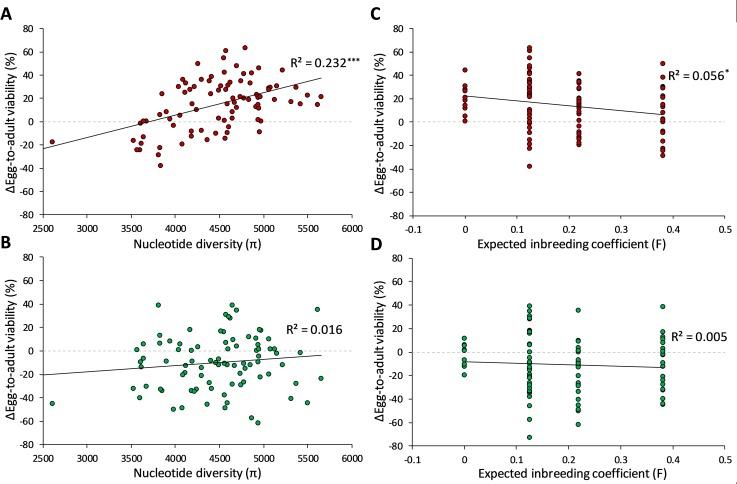
Fig 4. Genomic variation predicts evolutionary change in egg-to-adult viability in the stressful environment.
Correlations between nucleotide diversity (π) (A-B) or expected inbreeding coefficient (F) (C-D) and changes in egg-to-adult viability (Δ). Δ was calculated as the difference in egg-to-adult viability measured at generation 10 (Gen 10) and generation 0 (Gen 0) on the stressful medium on which the specific line had been reared on throughout the experiment (A and C), and on the benign medium (B and D). Thus, a positive change represents lines where the viability is higher after compared to before the experiment at the respective mediums. Black solid lines represent linear regressions to visualize the relationships, and R2 values are shown followed by asterisks denoting significant correlations; * P<0.05, ** P<0.01, *** P<0.001. We only considered difference in viability for lines that did not go extinct, and lines with available nucleotide diversity measures; in total this yielded 87 lines for computing the correlations. Dashed grey lines are shown at slope = 0 for comparison.

