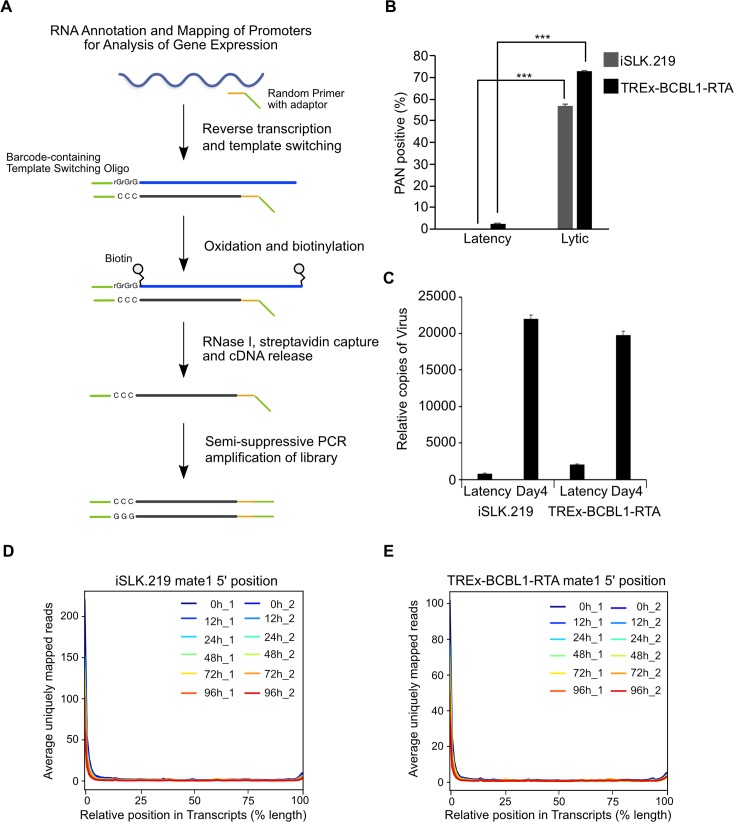
Fig 1. RAMPAGE enables transcription start site identification at nucleotide resolution.
(A) Schematic illustration of the RAMPAGE method. (B) iSLK.219 and TREx-BCBL1-RTA cells were reactivated for 72 h and the percentage of lytic reactivated cells was quantified by PAN RNA FISH-FLOW. (C) Virions were isolated from supernatants of iSLK.219 and TREx-BCBL1-RTA cells induced for 96 h and KSHV genomes were quantified by qPCR against ORF52. (D and E) Average uniquely mapped reads by position for endogenous transcripts, for libraries generated from (D) iSLK.219 and (E) TREx-BCBL1-RTA RNA. Error bars in all panels represent mean±SD from three independent experiments. p Values were determined by the Student’s t test ***, p < 0.001.

