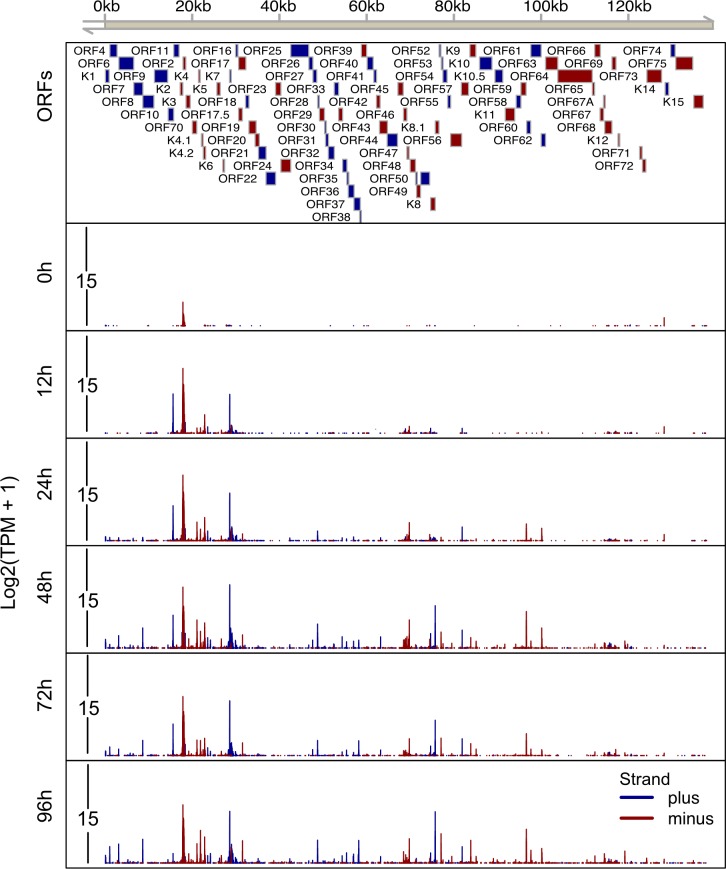
Fig 2. High resolution map of transcription start sites on the KSHV.219 genome in iSLK.219 cells.
Total RNA was isolated from iSLK.219 cells at 0h, 12h, 24h, 48h, 72h and 96h post-dox induced lytic reactivation and RAMPAGE libraries were prepared and sequenced. The 5’ signal of read 1, which corresponds to transcriptional start sites, were mapped on the KSHV genome (GQ994935.1). A schematic of the KSHV genome including genomic coordinates of annotated ORFs is depicted on the top horizontal axis. The lower 6 tracks depict the transcripts initiated from every nucleotide across the whole KSHV genome at each time point. The Y axis depicts the log2 transformed TPM value. Blue boxes/lines indicate ORFs/TSSs on the plus strand, red boxes/lines indicate ORFs/TSSs on the minus strand.

