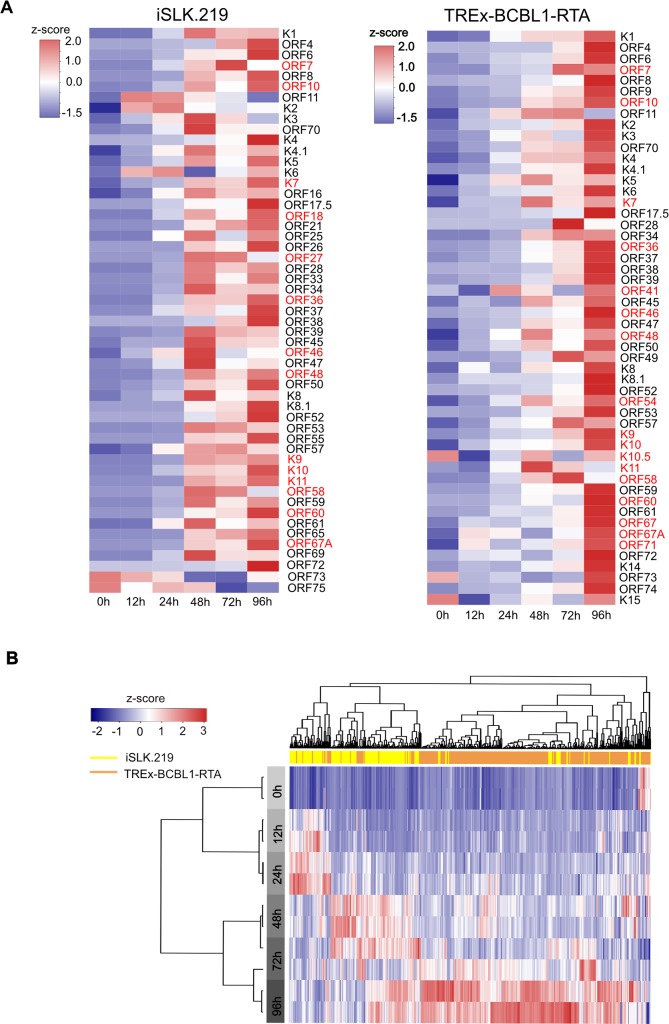
Fig 6. Kinetics of KSHV gene expression leveraging RAMPAGE.
(A) Heat map illustrating the expression level of known ORFs based on promoter activity at the indicated time points. iSLK.219 cells (left panel) and TREx-BCBL1-RTA cells (right panel). The TSCs of ORFs in red are identified for the first time in this study. (B) Unsupervised hierarchical clustering analysis of transcriptional activity of all viral TSCs identified by RAMPAGE. The top horizontal bar indicates the cell lines: yellow and tan represent iSLK.219 and TREx-BCBL1-RTA cells, respectively. The left gray bar indicates the time point of sampling after doxycycline induced lytic reactivation. For all heat maps TPM expressions of TSCs were scaled to Z score before mapping.

