
Figure 1.
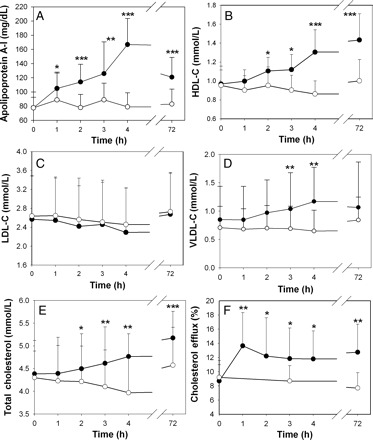
Changes in lipid and lipoprotein levels and capacity of plasma to support cholesterol efflux during and after reconstituted HDL infusion. (A) Changes in plasma concentration of apolipoprotein A-I. (B) Changes in plasma concentrations of HDL-C. (C) Changes in plasma concentrations of LDL-C. (D) Changes in plasma concentrations of VLDL-C. (E) Changes in plasma total cholesterol concentrations. (F) Changes in the capacity of patient plasma to support cholesterol efflux. Closed symbols, reconstituted HDL infusion arm; open symbols, placebo infusion arm. Mean ± SD are shown; n = 13; *P < 0.050; **P < 0.005; ***P < 0.001 (vs. pre-infusion values). Data presented at panels A, B and F were reported previously.9